Reference no: EM132168467
QUESTION 1
The following histogram and descriptive statistics summarise the basal heart rates of 557 patients with known or suspected coronary artery disease.
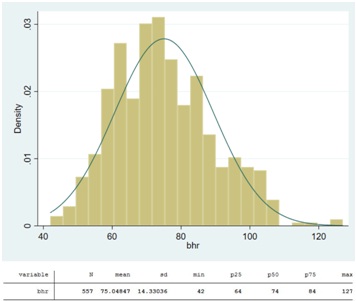
Which of the following options is the most correct description of the distribution?
1. The distribution of basal heart rate is unimodal and very skewed to the left
2. The distribution of basal heart rate is unimodal and approximately mound shaped and symmetric (apart from a few large outliers)
3. The distribution of basal heart rate is binomial
4. The distribution of basal heart rate is unimodal and very skewed to the right
QUESTION 2
A study was carried out to assess the usefulness of nicotine chewing gum as treatment for smoking. Three hundred and thirty-four smokers from a large retail company indicated that they were interested in taking part. Descriptive information for these smokers is given in the table below.
TABLE 1-Descriptive Data for the Sample (N = 334)
| Variable |
% or Mean |
| Sex |
|
| % of women |
70 |
| Grade |
|
| % senior management |
45 |
| % middle management |
42 |
| % non-management |
14 |
| Age |
34.3' |
| Cigarette consumption (per day) |
15.5" |
| 'SD 10 6. Range 1764 |
|
| SD 7.6, Range 1-40 |
|
Sutton S, Hallett R. Randomized trial of brief individual treatment for smoking using nicotine chewing gum in a workplace setting. Am J Public
Health 1987; 77:1210-1211
What type of data is:
Sex
Grade
Age
Cigarette consumption
QUESTION 3
A cohort of students of a certain age underwent standardised tests in Maths and English. The top 10% of students in each subject were awarded medals.
The scores on the Maths test were normally distributed with mean 55 and standard deviation 10. The scores on the English test were normally distributed with mean 60 and standard deviation 13.
Giselle's marks were 70 in Maths and 72 in English. Will she receive any medals?
1. Giselle will receive a medal for Maths
2. Giselle will receive a medal for English
3. Giselle will receive a medal for Maths and a medal for English
4. Giselle will not receive any medals.
5. There's not enough information
QUESTION 4
A researcher sets out to replicate the results of a well-established scientific phenomenon using a small study. However, the results do not reach statistical significance.
What kind of error is this?
What is the most likely reason this occurred?
QUESTION 5
Consider the boxplot below
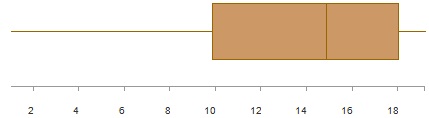
Which of the following statements is true?
Note: you may select more than one statement.
1. The distribution is skewed to the right.
2. The interquartile range is about 8.
3. The median is about 10.
4. The range is more than 16
5. The distribution is approximately normal
6. The distribution is skewed to the left.
QUESTION 6
The following diagram shows the sampling distribution of the mean in two studies. The blue study had a larger sample size than the red study.
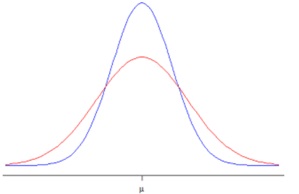
Which of the following statements about the standard error is correct?
1. The standard error is the standard deviation of the sampling distribution.
2. The standard error measures how far the sample means are likely to be from the population mean.
3. The standard error decreases as the sample size increases.
4. The standard error of the mean is larger in the red study than the blue study.
5. All of the above.
QUESTION 7
The analysis of data from a randomised controlled trial (RCT) usually provides an estimate of the treatment effect, which is the difference in the outcome between the comparison groups (e.g. intervention and control). The CONSORT guidelines 2010 recommend that reports of RCTs should include a confidence interval for the estimated treatment effect. A p-value can also be provided.
Explain in your own words, giving two reasons, why it is preferable to report a 95% confidence interval for the estimated treatment effect rather than only reporting the p-value.
Note: 2-4 sentences is sufficient. Dot points are fine.
QUESTION 8
Questions 8 to 11 relate to the following excerpt from:
Ilardo, Melissa A. et al. Physiological and Genetic Adaptations to Diving in Sea Nomads, Cell , 2013 Volume 173, Issue 3, 569 - 580.e15
Summary
Understanding the physiology and genetics of human hypoxia tolerance has important medical implications. but this phenomenon has thus far only been investigated in high-altitude human populations. Another system, yet to be explored. is humans who engage in breath-hold diving. The indigenous Bajau people (-Sea Nomads") of Southeast Asia live a subsistence lifestyle based on breath-hold diving and are renowned for their extraordinary breath-holding abilities. However, it is unknown whether this has a genetic basis. Using a comparative genomic study, we show that natural selection on genetic variants in the PDE10A gene have increased spleen size in the Bajau, providing them with a larger reservoir of oxygenated red blood cells. We also find evidence of strong selection specific to the Bajau on BDKRB2, a gene affecting the human diving reflex. Thus, the Bajau, and possibly other diving populations, provide a new opportunity to study human adaptation to hypoxia tolerance.
Results
Spleen Size Difference in the Bajau
We first set out to identify if there is evidence that the Bajau have larger spleens than their close geographic neighbors, the Saluan, who interact minimally with the marine environment. We identified two seaside villages -25 km apart in the Central Sulawesi peninsula of Indonesia: Jaya Bakti and Koyoan, primarily inhabited by ethnic Bajau and Saluan populations, respectively. We recruited 59 Bajau and 34 Saluan individuals to participate in the study. and from each individual we collected saliva samples for DNA and spleen measurements using a portable ultrasound machine. 16 Bajau individuals and 1 Saluan were found to be closely related to others from their respective communities based on genetic data. These individuals were excluded from all further analyses as most are based on the assumption that the individuals analyzed are not closely related. We made ultrasound measurements in two planes such that we were able to calculate spleen volumes according to the methodology outlined in Yeller et al. (2003) that best correlates with volumes obtained using a computed tomography (CT) scan. We used these measurements to compare spleen sizes in the two populations. revealing a clear visual difference, with the mean spleen size being higher among the Bajau (Figure 1). This difference was statistically significant (Welch two-sample t test, p = 3.538e-07). Notably, this
The outcome variable is:
1. Spleen size (continuous)
2. Bajau vs. Saluan (binary)
3. BDKRB2 genotype (categorical)
4. Breath-holding time (continuous)
QUESTION 9
The hypothesis test described in the excerpt in Question 8 is the 'Welch two-sample t-test' which is another name for the two-sample t-test with unequal variances.
Which of the following assumptions need to be satisfied for this test to be valid?
Note: You may select more than one option.
1. The observations are independent
2. The groups are independent
3. The groups are dependent
4. The distributions of the two samples of data are approximately mound-shaped and symmetric
5. The distributions have equal variances
QUESTION 10
Figure 1, which is referred to in the excerpt in Question 8, is shown below.
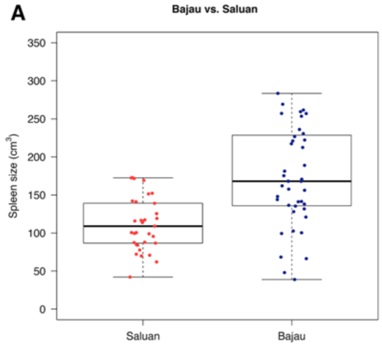
Figure 1A. Distributions and boxplots of spleen sizes in all not closely related Saluan (n = 33) in red and Bajau (n = 43) in blue. The thick black center lines represent the medians and the lower and upper limits of the boxes represent the 25th and 75th percentiles, respectively. Outliers are not shown.
The researchers say that there is a "clear visual difference" in the outcome between the groups. Describe how the boxplot shows this with reference to specific features of the distribution.
Note: 2-3 sentences is sufficient. Dot points are fine.
QUESTION 11
The researchers are looking for evidence that the Bajau, who have an extraordinary ability for breath-hold diving, "have larger spleens than their close geographic neighbors, the Saluan, who interact minimally with the marine environment".
Which of the following sets of hypotheses are the most appropriate for the statistical analysis described in Question 8?
1. H0: The mean spleen size in Bajuan people is equal to the mean spleen size in Saluan people
HA: The mean spleen size in Bajuan people is not equal to the mean spleen size in Saluan people
2. H0: The mean spleen size in Bajuan people is equal to the mean spleen size in Saluan people
HA: The mean spleen size in Bajuan people is greater than the mean spleen size in Saluan people
3. H0: The mean spleen size in Bajuan people is greater than the mean spleen size in Saluan people
HA: The mean spleen size in Bajuan people is less than or equal to to the mean spleen size in Saluan people
4. H0: The mean length of time the Bajuan people can hold their breath is equal to the mean length of time the Saluan people can hold their breath
HA: The mean length of time the Bajuan people can hold their breath is not equal to the mean length of time the Saluan people can hold their breath
QUESTION 12
Questions 12 to 14 relate to the following information and excerpt.
DESMOND (Diabetes Education and Self Management for Ongoing and Newly Diagnosed) is a structured group education program for patients with Type 2 diabetes. The results and excerpts in this question are from a report following a cluster randomised controlled trial into the effectiveness of the education program.
Davies M J, Heller S, Skinner T C, Campbell M J, Carey M E, Cradock S et al. Effectiveness of the diabetes education and self management for ongoing and newly diagnosed (DESMOND) programme for people with newly diagnosed type 2 diabetes: cluster randomised controlled
A sample of 207 general practices (totaling 824 patients) were randomised at practice level to either the education program orusual care. According to the report, the main outcomes were Haemoglobin A1c levels, blood pressure, weight, blood lipid levels, smoking status, physical activity, quality of life, beliefs about illness, depression, and emotional impact of diabetes. These outcomes were measured at baseline, 4 months, 6 months, and 12 months.
The attached table contains a summary of results of the analyses (significance of outcomes at 12 months). Full tables of results are available in the report but they are not necessary for answering this question.
Explain in your own words the problem of multiple outcome testing with reference to the above results.
Note: 2-5 sentences is sufficient. Dot points are fine.
QUESTION 13
A common method for dealing with the problem of multiple outcome testing is called a Bonferroni adjustment, which is where the significance threshold is set at 0.05/n (alpha divided by the number of tests being performed). This method maintains the overall Type I Error rate at 5% (i.e., the probability of one or more false positives out of the set of n tests being performed is 5%).
For the number of tests being performed in Question 12, the Bonferroni-adjusted significance threshold should be set at ............... (Enter your answer as a number between 0 and 1, rounded to 4 decimal places)
How many of the 12 month outcomes would be significant at the adjusted threshold? .................
QUESTION 14
The clustered RCT in Question 12 was designed to have 90% power to detect a clinically relevant difference of 0.01 between groups in the Haemoglobin A1c outcome, assuming a standard deviation of 0.02 and a significance level of 5%. An intraclass correlation of 0.05 and the number of participants per practice was expected to be 18.
Which of the following options provides the total sample size required for the clustered RCT?
Note: PSPower was used here (and then the design-effect formula was applied). If you use another method your numbers may differ slightly. Select the closest option.
1. Before taking clustering into account around 88 participants would be needed.
For the clustered trial 163 participants would be needed.
2. Before taking clustering into account around 85 participants would be needed.
For the clustered trial 158 participants would be needed.
3. Before taking clustering into account around 170 participants would be needed.
For the clustered trial 323 participants would be needed.
4. Before taking clustering into account around 170 participants would be needed.
For the clustered trial 315 participants would be needed.
QUESTION 15
The following is paraphrased from the protocol paper for an RCT:
‘Study protocol for the randomised controlled trial: Antiglucocorticoid augmentation of anti-Depressants in Depression (The ADD Study)', McAllister-Williams R.H., et al, BMC Psychiatry (2013) 12:205.
Patients with depression who do not respond to a first or second treatment with anti-depressants are characterised as having treatment refractory depression (TRD). A Cochrane review suggested that co-treatment with an antiglucocorticoid such as metyrapone may be effective in treating TRD.
The study will be powered for a conservative moderate effect of a 6 point difference on average between intervention and control on the MADRS scale assuming a 12 point standard deviation.
a) What sample size is required to detect this effect with 90% power and type I error rate fixed at 5%?
b) A 10% dropout rate is expected. How many patients need to be recruited, taking attrition into account?
Attach a file (.pdf or .docx) containing your answer and working.
Notes:
1. You MUST show/explain evidence of your method of calculation, for example, include the formulas, the Stata command, or a screenshot from PSPower.
2. Make it clear what your final answer is in a concluding sentence.
3. The different methods (formula, Stata, PSPower) will give slightly different answers due to rounding. All answers arrived at by a correctly applied method will be marked as correct.
QUESTION 16
The Table attached shows the baseline characteristics for a weight loss randomised controlled trial.
Anderson et al, The impact of a bodyweight and physical activity intervention (BeWEL) initiated through a national colorectal cancer screening programme: randomised controlled trial, BMJ 2014;348:g1823
True or False: The table should provide p-values for testing the differences in baseline characteristics between the groups.
True
False
QUESTION 17
Attached is the output from a two sample t-test of the difference in mean basal blood pressure between men and women. The significance level was set at 5% and the null hypothesis stated a two-sided test would be performed.
Which of the following is the best statement of the conclusion from this test?
1. Blood pressure in Female patients is 5.8 units higher on average compared to Male patients (p=0.0006)
2. Blood pressure in Female patients is 5.8 units lower on average compared to Male patients (p=0.0013)
3. Blood pressure in Female patients is 5.8 units higher on average compared to Male patients (t=-3.2402)
4. Blood pressure in Female patients is 5.8 units higher on average compared to Male patients (p=0.0013)
QUESTION 18
Adapted from Dawson B and Trapp RG "Basic and Clinical Biostatistics" McGraw-Hill 2001.
Tables(attached) are a very useful way to display relationships. When two measures are of interest, the purpose of the study generally determines which measure is viewed within the context of the other. Suppose investigators are interested in the relationship between levels of patient medication compliance and their type of USA health insurance coverage.
If the investigators wish to show the percentage of patients with different types of insurance coverage within each of the three levels of patient compliance which of the two tables (1a, 1b) should investigators use in their paper to show this relationship?
QUESTION 19
1. Questions 19 and 20 refer to the information below.
A randomised trial was used to assess the effect of a self-help smoking cessation program for pregnant women. Some of the results are attached below.
Recreate a 2x2 contingency table showing the number of participants in each Group who Quit and/or Reduced, and the number who had no change. (You don't have to do it in Stata)
QUESTION 20
Enter the Stata command you would use to test whether the proportion of women who Quit and/or Reduced was different between the control and intervention groups.
QUESTION 21
A researcher undertakes an experiment to test a hypothesis. If she doubles her sample size, which of the following will definitelyincrease?
1. The power of the hypothesis test
2. The estimated effect size
3. The probability of making a Type II error
4. The probability of making a Type I error
Attachment:- Statistics.rar