Reference no: EM13132108
Question
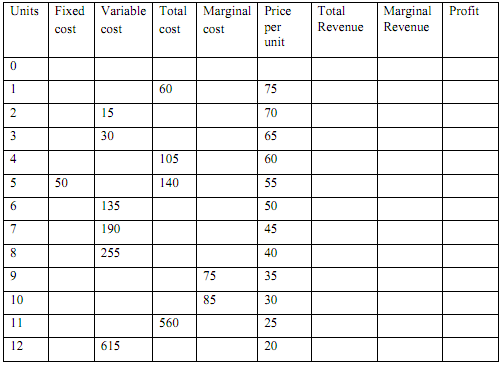
(a) The table below shows the cost schedule for a competitive firm.
i) Complete the table.
ii) Using the numbers from the table above, draw a diagram showing Marginal Cost, Average Total Cost, Average Variable Cost and Average Fixed Cost curves.
iii) Comment on the shape of the curves.
iv) Using two rules find the profit maximising output if the price is $70. What is the maximum profit at this level of output? Illustrate on your diagram.
v) Repeat the analysis to find revenue and profit/loss if the price per unit is $20. What is the maximum profit/loss at this level of output?
(b) The table below shows similar cost information, but now applies to a monopoly firm.
i) Complete the table.
ii) Using the numbers from the table above, draw a diagram showing how the monopolist makes a decision regarding production levels.
iii) Identify the level of output and price under the monopoly market structure.
iv) Explain the level of resource misallocation comparing the outcome under the Monopoly situation with the outcome under perfect competition (where the price is $70 per unit)
|
Question regarding euler diagram
: Create an Euler diagram to determine whether the syllogism is valid or invalid: Some nurses are patient.
|
|
What is the percent yield
: The mass of iron produced by the reaction of 7.00 kg of Fe2O3 and 3.00 kg of CO is 3.55 kg. What is the percent yield? (Atomic weights: Fe = 55.85, O = 16.00, C = 12.01)
|
|
Create forecast using trend model or judgment forecast
: Which trend model is best, and why? If none is satisfactory, explain. (e) Make a forecast for 2003, using a trend model of your choice or a judgment forecast.
|
|
Explain information about degree of unsaturation
: Important information about Degree of Unsaturation, Dieldrin, C12H8Cl6O, is a pentacyclic compound formerly used as an insecticide.
|
|
Explain the level of resource misallocation
: Explain the level of resource misallocation comparing the outcome under the Monopoly situation with the outcome under perfect competition
|
|
Christine income from consulting
: real property taxes $3,900 interest on home mortgage 4,000 operating expenses of home 1,100 depreciation allocated to 20% business use 1,600 Christine's income from consulting is 16,000, and the related expenses are $5,000.
|
|
Determining euclidean algorithm
: Modify the Euclidean algorithm to find the greatest common divisor of 2x^3 + x^2 - 2x - 1 and x^2 + 3x + 2. This requires long division with polynomials.
|
|
Find the standard deviation of paint distribution
: Known that 15% of walls painted with this paint need more than 55 minutes to dry completely. Find the standard deviation of this distribution.
|
|
How many exemptions should he claim on his tax return
: His mother was a resident of a home for the aged for the entire year and had no income. What is Murray's filing status for 2011, and how many exemptions should he claim on his tax return?
|