Reference no: EM132389767
Part - A
Question 1:
Explain the meaning of market equilibrium for the market for rental accommodation show your answer with a diagram
If the government decided to impose rent control in Australia's capital cities as a way to prevent rising rents what might happen. Use a supply and demand diagram to show the effects of this action. What would landlords do as a response? Is rent control a valid solution?
Question 2
Explain the impact of the following events on the peanut industry
(Use Supply and demand diagram in your answer):
a) The price of fertilizer used in growing peanuts rises
b) Consumers' tastes change so that they now prefer popcorn to peanuts
c) A drought reduces the productivity of land used to produce peanuts
d) Doctors find that peanuts are bad for the overall general health
Question 3
Suppose the price elasticity of demand for railway travel is elastic. If the rail authority wants to raise revenue from fares, should it raise them or lower them? You might illustrate your answer with a diagram
Question 4
Using diagrams in your answer what are the possible circumstances under which the burden of an excise tax would be borne
i) entirely by consumers
ii) entirely by producers.
Question 5
How do the diminishing marginal returns to scale differ from diseconomies of scale?
What is the difference between a firm's explicit costs and implicit costs?
Question 6
What is the difference between the price elasticity of demand and the income elasticity of demand? What does the cross elasticity of demand measure? Why should a firm or business know the difference between each of the three concepts?
Question 7
(a) Illustrate and explain using diagrams how a single seller within the market causes an inefficient allocation of resources and why that is bad;
(a) What market structure is used to benchmark allocative efficiency and why do we use it? Illustrate and explain using a diagram
Question 8:
Illustrate and explain using diagrams, two (2) market mechanisms that can be used for controlling pollution as a negative externality.
Question 9:
The following diagram shows the cost curves of a firm under perfect competition.
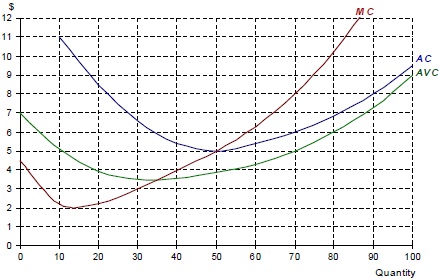
(a) How much will the firm produce in order to maximise profits at a price of $8 per unit?
(b) What will be its average cost of production at this output?
(c) How much (supernormal) profit will it make?
(d) How much will the firm produce in order to maximise profits at a price of $5 per unit?
(e) How much (supernormal) profit will it make?
(f) How much will the firm produce in order to maximise profits at a price of $4 per unit?
(g) What will be its profit value be now?
(h) Below what price would the firm shut down in the short run?
(i) Below what price would the firm shut down in the long run?
Part - B
Question 1:
Consider a macroeconomy was initially at equilibrium. Using an aggregate demand and aggregate supply diagram model of the economy, graphically illustrate and discuss the short-run and long-run effects of the following events upon the economy:
(a) The imposition of a carbon tax upon local big polluting companies.
(b) An appreciation in the foreign exchange rate value of the economy's currency.
(c) The European economies all fall into recession
(d) The country's main exports fall in price while the goods the country imports from abroad rise in price (2 marks)
Question 2:
2a. State the difference (IN YOUR OWN WORDS) between:
-absolute advantage and comparative advantage.
-between the terms of trade and the exchange rate
- between a demand side shock and a supply side shock
-between a trade surplus and a budget surplus (2.5 marks each)
OR
2b. State the difference between:
-uncertainty and risk.
-between the interest rate and the exchange rate
- between a supply side shock and a demand side shock
-between a trade deficit and net foreign debt (2 marks)
Question 3
Use the Australian Bureau of Statistics website and perhaps the Reserve Bank of Australia website to answer the following questions: What are the current levels of the following economic indicators in the Australian economy? (Remember these should be expressed in annual terms)
Inflation
Unemployment
Economic growth rate
The cash rate
The Australian dollar exchange rate
Question 4
Use the aggregate demand- aggregate supply diagram model to explain the consequences in terms of price level and real GDP of a decline in aggregate demand as shown by:
(a) Classical economics
(b) Keynesian economics
Why did the classical economists believe the economy would always find equilibrium at full employment and the Keynesians did not?
Question 5
Assume an economy operates on the middle part of its aggregate supply curve. State the direction of effect on aggregate demand or aggregate supply for each of the following changes in conditions. What is the effect on the price level, real GDP and employment? Use diagrams in your answer.
(a) The price of crude oil rises significantly
(b) Spending on welfare and aged pensions doubles
(c) The value of the currency falls on the foreign exchange market. i.e the currency depreciates
(d) The Government halves the goods and services tax (GST) on all consumer goods
(e) The Government announces rises in company tax. (2 marks per part)
Question 6
If you wanted to increase aggregate demand how would you do it for the following:
Consumption demand
Investment demand
Net exports
Which of the three components also has an impact upon the Aggregate supply side of the economy?
Question 7
Consider a macroeconomy was initially at equilibrium level of real GDP. Using an aggregate demand and aggregate supply diagram or model of the economy, graphically illustrate and discuss the short-run consequences of the following events upon an economy:
(a) The Central Bank within the economy lifts interest rates.
(b) There is an increase in private domestic investment spending.
(c) An increase in the good and services tax (GST)
(d) An appreciation or rise in the foreign exchange rate value of the economy's currency.
(e) A fall in real estate prices in the capital cities of the country (hint: think of the effect upon people's wealth level)
Question 8
Why are quarterly movements in a country‘s GDP measure so important? What is it called when a country has two successive negative quarters of economic growth? When the economy is heading into a recession what economic policy instruments can the government and the central bank use to prevent this from occurring? Will these instruments work to prevent the onset of recession?