Reference no: EM131263415
Please realize that you are essentially creating "your brand" when you submit this homework.
Do you want your homework to convey that you are competent, careful and professional? Or, do you want to convey the image that you are careless, sloppy, and less than professional. For the rest of your life you will be creating your brand: please think about what you are saying about yourself when you do any work for someone else!
Part I: Math review
1. Imagine that you are studying how the number of rabbits and chipmunks evolved between 1950 and 2000 in Madison, Wisconsin. You have collected historical data and have summarized it in the following graph:
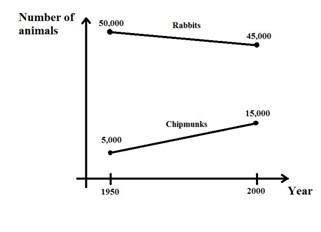
a) Find an expression for each species that helps you calculate the number of animals of each species between 1950 and 2000 as a function of the year. Use R as a symbol for rabbits, C as the symbol for chipmunks, and Y as the symbol for years. You will be finding two separate equations.
b) For which year was the population of rabbits approximately four times the population of chipmunks?
c) There is data that supports the hypothesis that the linear trends observed between 1950 and 2000 will continue in the future. By which year will both populations be approximately the same?
2. Imagine that you are planning a trip to Europe and are deciding which clothes to pack. You remember from your high school classes that there exists a linear relationship between Celsius and Fahrenheit degrees. You also recall that 0°C is equal to 32°F, and 20°C is equal to 68°F.
a) Derive the formula that converts temperature expressed in Fahrenheit to Celsius. Show explicitly how you found this formula only considering the data included in the question. Measure Celsius on the vertical axis and provide your equation in slope-intercept form where C is Celsius and F is Fahrenheit.
b) Derive the formula that converts temperature expressed in Celsius to Fahrenheit. (That is, rewrite this formula in X-intercept form where the X- variable is still Fahrenheit (F).) Show your work.
c) If you know that the weather forecast is 35°C, what is the temperature forecast in Fahrenheit?
d) The weather forecast expressed in Celsius unexpectedly decreases by 20% from the expected 35°C. By what percentage does the forecast in Fahrenheit decrease?
e) Does your answer to d) change if the original weather was forecast to be 20°C instead of 35°C? Explain your answer fully.
3. Jimmy and Jane are two close, but very competitive friends. They are both taking Math 202 this semester. In their class, the final grade is obtained as follows: the midterm test is worth 25% of the final grade, while the final test is worth 75% of the grade. Jimmy got an 80 on the midterm and a 60 on the final test. Meanwhile, Jane got a grade on the midterm that was 12.5% lower than Jimmy's. What should be the percentage difference in Jane's grade on the final test with respect to Jimmy's, so that she obtains exactly the same final grade as he does?
Part II: Opportunity cost, absolute advantage, comparative advantage, Production Possibility Frontier (PPF)
4. Mary and Orson own farms on Central Wisconsin. Mary owns Farm 1 comprised of 20 acres of land, while Orson owns Farm 2 comprised of 30 acres of land. The type of soil in each farm is different. For each acre of land assigned to apple production, Mary harvests 5 apples per year while Orson harvests 8 apples per year. For each acre of land assigned to orange production, Mary harvests 10 oranges per year, while Orson harvests 9 oranges per year. Assume that Mary and Orson can produce either apples or oranges on any acre in any year.
a) Given the above information, what is the maximum amount of apples that Mary and Orson can harvest in a year? What is the maximum amount of oranges that Mary and Orson can harvest in a year?
b) Given the information above, what is Mary's opportunity cost of harvesting one more apple? What is Orson's opportunity cost of harvesting one additional apple? Who has the lowest opportunity cost of producing an additional apple?
c) Who has the absolute advantage in producing apples? Who has the absolute advantage in producing oranges?
d) Draw two separate graphs: on the first graph represent Mary's PPF and on the second represent Orson's PPF. In each graph, measure apples on the X-axis and oranges on the Y-axis.
e) Consider that Mary decides to sell all the land she owns to Orson. This sale doesn't affect the previous levels of productivity of Mary's farm. Draw the new PPF of Orson ("joint PPF"), considering that he now owns both farms. As before, graph in the X-axis the amount of apples and in the Y-axis the amount of oranges. Label clearly the coordinates for any "kink points".
f) Orson has been hired to sell produce to Whole Foods Market. They have ordered Orson to harvest at least 100 apples and 350 oranges every year. Will Orson be able to satisfy this level of production?
g) (Challenging) Now consider that Orson can decide freely how many apples and oranges to harvest in both farms and that the sale price of apples and oranges is the same. If Orson wants to maximize the amount he earns, how many apples and oranges would he harvest? How would he divide the production of fruits between Farm 1 and Farm 2?
h) (Even more challenging) Return to the original setup where Orson owned only Farm 2. Draw the PPF of Orson if he now faces the following restriction: In order to start harvesting a particular type of fruit, he needs to install a special watering device that occupies 5 acres of land (no fruit will grow on the land devoted to this water device) and that is specific to the type of tree planted. In this sense, Orson could plant both types of trees at his farm, but then he would need to install two different watering devices (and he would lose 10 acres of land).
5. Professor Kelly's analysis of available hours in a week has left you thinking about how to boost your performance in the two classes (Economics and Calculus) that you are taking this semester. You face the following restrictions:
- You only have 20 hours to spend studying for these two classes.
- The grade range used for these two classes goes from 0 to 100.-
If you don't study at all for a class, you'll get a 0.
- The first 10 hours that you spend studying for each of the classes has an important effect on your grade. On the one hand, you estimate that for every hour that you spend on Economics, you'll observe an increase of 7 points in your grade in that class. On the other hand, for every hour that you spend in Calculus, you'll observe an increase of 6 points in your grade in that class.
- If you spend more than 10 hours on a single class, diminishing returns kick in. You estimate that one additional hour of studying after the 10-hour limit will result in an increase of 3 points in your Economics grade and an increase of 4 points in your Calculus grade.
a) If you plan to study Economics for 12 hours and Calculus for 8 hours, what would be the opportunity cost of studying Economics one additional hour in terms of your Calculus grade? What would be the opportunity cost of obtaining one additional point in Economics in terms of your Calculus grade? [Hint: you might find it helpful to organize this information in a table like the following:
|
Hours Studying Econ
|
Grade in Econ
|
Hours Studying Calculus
|
Grade in Calculus
|
|
0
|
0
|
20
|
100
|
|
1
|
7
|
19
|
96
|
|
...
|
...
|
...
|
...
|
|
|
|
|
|
|
|
|
|
|
b) If you plan to study Economics for 8 hours and Calculus for 12 hours, what would be the opportunity cost of studying Economics one additional hour in terms of your Calculus grade? What would be the opportunity cost of obtaining one additional point in Economics in terms of your Calculus grade?
c) Graph a PPF for the grades you can obtain this semester. On the X-axis, graph your final grade (Points in Economics) in Economics and on the Y-Axis, graph your final grade (Points in Calculus) in Calculus. (Hint: The PPF has a "kink point". Try to use your answers to a) and b) to identify this point. Label clearly the coordinates for this point.)
d) Find a mathematical expression for the grade you can obtain in Calculus, in terms of your Economics grade (This will be a set of equations representing your "Grade PPF").
e) You need a 65 in each of the subjects to get a B. Can you get a B in both Economics and Calculus?
f) (Optional - Very challenging) Suppose you realize that you have instead 24 hours instead of 20 hours, graph the PPF for the grades. (Hint 1: Consider the grade range carefully. If you study more than 20 hours for each of the subjects, you will still get a 100; Hint 2: You have more than one "kink point" now. Hint 3: You might find it helpful to construct a table similar to the one you made earlier!)