Reference no: EM132386985
Assignment
1. The Bode Diagram of a process is shown in figure 1.
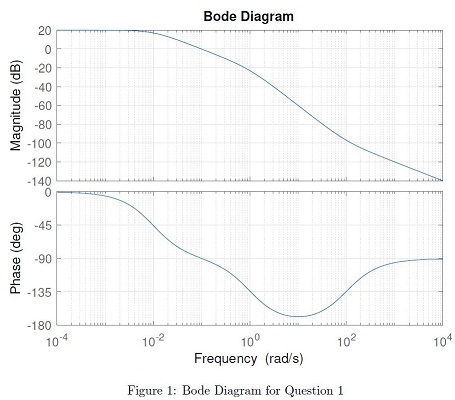
Determine its transfer function.
2. Consider the transfer function of a plant is given as follows:
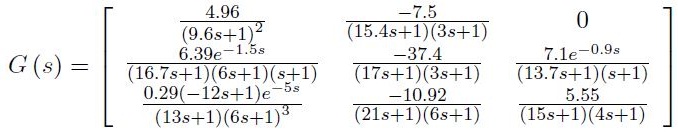
(a) Write a Matlab program (m-file) to compute the range of gains of the above process at different frequencies. Draw the singular value plot for the above process using Matlab.
(b) The condition number of the frequency response G (jw) can be defined as cond (G (jw)) = a (G ( jw))
It can be used to indicate whether a process is difficult to control. Write a matlab program to find the condition number of the frequency response of above process as a function of frequency.
3. Singular value decomposition can also be applied to "non-square" systems - for example, a process with more inputs than outputs.
Consider the following steady -state gain matrix of a process system:
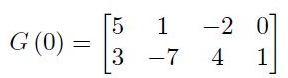
(a) Use Matlab to find the singular value decomposition of the above gain matrix in the form of G (0) = XΣV* . What are the maximum and minimum steady state gains for this process?
(b) Assume V = [v1 v2 v3 v4] . On the direction(s) of whi column(s) of V does the inputs have no effect on the outputs?
(c) It is easy to verif that an input of u‾ = [1 1 1 1]T results in the output y‾ = [4 1]T . Write a general expression for all possible inputs that result in the output 9.
(Hint: Similar to linear differential equations, the general solution to a linear equa¬tion is the sum of the complementary solution and a particular solution).