Reference no: EM131415657
Assignment
Problem 1. Consider the following decision tree.
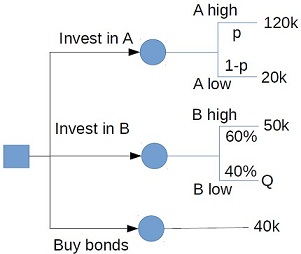
There are two parameters, p and Q, which are not known precisely.
|
|
low
|
base
|
high
|
|
p
|
10%
|
30%
|
50%
|
|
Q
|
25k
|
30k
|
40k
|
Conduct sensitivity analysis. First, determine the expected earnings as a function of the variables p and Q:
E[earnings of A] =
E[earnings of B] =
E[earnings of C] =
Second, determine the expected earnings using the base-case values for p and Q:
E[earnings of A] =
E[earnings of B] =
E[earnings of C] =
Draw the one-way sensitivity plots for p and Q. Label the curves.
Draw the tornado diagrams for strategies A and B. Label the axes.
Draw the two-way sensitivity plot for p and Q. For each boundary denote which strategy is preferred and for each region denote the preferred strategy.
Problem 2. The following questions involve calculating how money changes value over time. You do not need to calculate the final answer. You do need to simplify your answer so the quantity of interest is on the left hand side and all numbers are on the right. For instance, if asked to find a return rate r, your final answer should look like "r = . . . " Recall the formula FV = P V (1 + r)n.
A. 10 years ago, you invested $1000 in a savings account with 5% yearly compounded interest. Inflation has been stable at 2%.
1. What is the current dollar amount of your investment?
2. What is the current purchasing power in 2007 dollars?
B. Your friend asks to borrow $10 , 000. He says he'll pay you back $5000 after five years and $7500 after 10 years. Suppose inflation is 2%. What is the net present value of this deal?
C. You have $1000 to invest. Inflation is 2%.
1. You invest in a savings account with 5% interest. How many years n of com- pounding will it take for the dollar amount to double?
2. What interest rate r should you invest at so the purchasing power of your money will double after 25 years?
Problem 3. Show your work, even if you cannot finish the calculations.
Using the profit matrix below (rows correspond to strategies {Ai} and columns correspond to scenarios {Sj}), as well as the table of scenario probabilities, determine which strategy is preferred for each of the following criteria (if any):
|
|
S1
|
S2
|
S3
|
S4
|
|
Probability (%):
|
20
|
40
|
30
|
10
|
|
|
S1
|
S2
|
S3
|
S4
|
|
A1
|
10
|
50
|
50
|
30
|
|
A2
|
40
|
30
|
70
|
40
|
|
A3
|
20
|
20
|
40
|
60
|
A.Expected value
B.Risk profile dominance (label the curves)
|
|
S1
|
S2
|
S3
|
S4
|
|
A1
|
10
|
50
|
50
|
30
|
|
A2
|
40
|
30
|
70
|
40
|
|
A3
|
20
|
20
|
40
|
60
|
C.Laplace
D.Maximax
E.Maximin
|
|
S1
|
S2
|
S3
|
S4
|
|
Probability (%):
|
20
|
40
|
30
|
10
|
|
|
S1
|
S2
|
S3
|
S4
|
|
A1
|
10
|
50
|
50
|
30
|
|
A2
|
40
|
30
|
70
|
40
|
|
A3
|
20
|
20
|
40
|
60
|
F.Minimax regret
G.Minimum expected regret.
|
What is natural about the natural rate of unemployment
: What is "natural" about the natural rate of unemployment. Why might the natural rate of unemployment differ across countries? Explain the Origins of the Phillips Curve.
|
|
Compute these ratios for mountain-pacific railroad
: Compute these ratios for Mountain-Pacific Railroad for both 2011 (using year-end balances) and 2012 (using average balances where appropriate). Identify significant trends. Could the company experience solvency problems? Explain.
|
|
Define wireless technologies and mobile technologies
: Define wireless technologies and mobile technologies. Next, determine at least three (3) ways which companies or organizations utilize such technologies to improve business efficiency. Determine the wireless technologies and mobile technologies t..
|
|
Make use of their companies work life policies
: What are the cost and benefits to a company providing full benefits and training to those employees who work part time? What risk do employees take when they make use of their companies work life policies? Are these risks the same for men and women?
|
|
Draw the one-way sensitivity plots for p and q
: Draw the one-way sensitivity plots for p and Q. Label the curves. Draw the tornado diagrams for strategies A and B. Label the axes. Draw the two-way sensitivity plot for p and Q.
|
|
What is the most important element of freud perspective
: This module addressed research methodologies used to better understand the construct of personality. Which of these methods produces the most valid information in the real world of personality research? Why? What is the most important element of F..
|
|
Rank the segments in terms of return on assets
: Compute the percent each segment contributes to the total revenues reported for 2008.
|
|
Why visualization technologies are becoming an important
: Determine the main reasons why visualization technologies are becoming an important part of organizational success. Select two (2) such technologies related to information systems and analyze the manner in which the utilization of the selected tec..
|
|
Write a paper regarding an aspect of data management
: Data security. Submit 5-7 page research paper regarding an aspect of data management.APA format should be followed in regard to the completion of this paper. It should be APA 6.0 format.
|