Reference no: EM131405782
CONTROL SYSTEMS AND AUTOMATION - CONTROL DEVICES AND SYSTEMS ASSIGNMENT
Q1. A control valve is to be used to control water flow at a maximum rate of 120 US gallons per minute. If the maximum pressure drop across the valve is 100 psi, determine the valve size required for this particular application. The table below relates CV and valve size.
|
CV
|
Valve size (inches)
|
|
0.3
|
¼
|
|
3
|
½
|
|
14
|
1
|
|
35
|
1½
|
|
55
|
2
|
|
108
|
3
|
|
174
|
4
|
|
400
|
6
|
|
725
|
8
|
|
Table 1
|
Q2. FIGURE 1 shows the valve characteristics of three different types of valve trim.
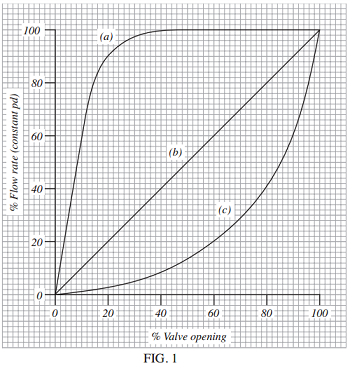
(i) Identify each of the three characteristics.
(ii) State, with reasons, a typical type of application for each of the three types of valve trim.
Q3. Write brief notes on the following topics:
(a) flashing in control valves
(b) cavitation in control valves
(c) control valve noise
(d) reasons for the use of valve positioners.
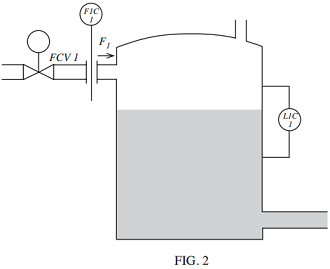
Q4. The level of liquid in an open tank (FIGURE 2) is to be controlled by regulating the flow of liquid into the vessel.
(a) Complete the drawing to show how the level can be controlled by linking the liquid inflow and liquid level controls in cascade.
(b) Draw a control block diagram of the cascaded system.
(c) Describe the response of the cascaded system to a change in the measured level of liquid.
Q5. FIGURE 3 shows the block diagram of the control of an electric heating system. The heater is driven from a voltage-controlled power supply, the voltage V1 being derived from a potientiometer. The output temperature, θO, is subject to disturbances, θD, because of changes in the ambient temperature. It is proposed to apply 'disturbance feedback control' to the system by the inclusion of a transducer that measures the external temperature and feeds a signal back to the input via a proportional controller of gain H.
Determine the required value of H to eliminate the effect of the disturbance.
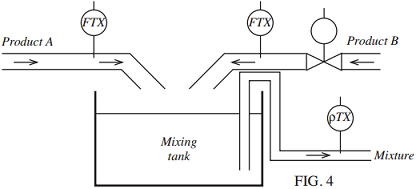
Q6. The purpose of the arrangement shown in FIGURE 4 is to mix the two liquid products A and B in a fixed mass ratio. Product A, which is itself a mixture, is a 'wild' flow, whilst product B, a pure compound, is controlled.
As the mixture leaves the tank the transmitter ρTX measures its density.
(a) Complete the diagram to show how the arrangement could be controlled by the method of 'variable ratio control'.
(b) Identify which transmitter provides 'feedforward'.
(c) Describe how the control system responds to a disturbance caused by a variation in the density of product A.
Q7. FIGURE 5 shows a partially completed diagram of a flow control system. The flow controller is reverse acting and has a 0.2 to 1.0 bar pneumatic output signal which will supply both control valves V1 and V2.
The small range control valve, V2, only needs to operate on the first 25% output change of the controller output signal. For larger flow rates the small range valve will remain fully open and control will be achieved by operation of the large range valve. Note the differing air failure action of the two valves.
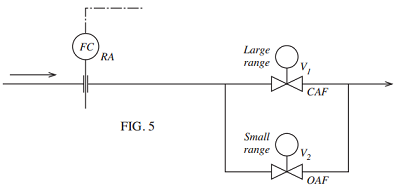
Design a system utilising valve positioners which will meet the prestated specifications.
|
Make hypothesis statements specific to given situation
: Write null and alternative hypotheses about the relationship between the two variables in this situation. Make your hypothesis statements specific to this situation.
|
|
Identify three training needs though training needs analysis
: Design a two day training program for a group of twenty employees. Identify two to three training needs though a Training Needs Analysis (TNA) and justify an approach for this training.
|
|
Relationship between the two variables in given problem
: For this table, the value of the chi-square statistic is 17.78, and to three decimal places, the corresponding pvalue is .000. Based on these results, state a conclusion about the two variables, and explain why you came to this conclusion.
|
|
What style of leadership is the most effective in leading
: What style of leadership is the most effective in leading an organization? Is it important to be well-liked, or are results all that matter?
|
|
Draw a control block diagram of the cascaded system
: The level of liquid in an open tank (FIGURE 2) is to be controlled by regulating the flow of liquid into the vessel. Complete the drawing to show how the level can be controlled by linking the liquid inflow and liquid level controls in cascade. Draw..
|
|
How does the leader conduct a stakeholder analysis
: How does the leader engage stakeholders (vendors, executives, board members, employees) in the innovative or creative process? For example, how does the leader conduct a stakeholder analysis?
|
|
Calculate a table of expected counts for the data
: Calculate a table of expected counts for the data in given Exercise.- Show calculations verifying that the value of the chisquare statistic is 17.78.
|
|
Would you say that steve jobs was an ethical leader
: Based on the readings for the week, would you say that Steve Jobs was an ethical leader? State your rationale. Are you an Acolyte or a Rejector? Why?
|
|
Use the dow jones industrial stocks as your data set
: Use the Dow Jones Industrial stocks as your data set.Find the gain or the loss for each stock over the last quarter.Test the claim that the mean is that the stocks broke even (no gain or loss indicates a mean of 0)
|