Reference no: EM132369654
Assignment : Inference in Fama-French Models of Assets Pricing
Assignment Details
Suppose you are a quantitative equity analyst working for an investment bank based in New York. Your team manager is responsible for the local US equity portfolio performance. There are ten NYSE equity securities with significant holdings in your investment bank’s portfolio.
Your manager has assigned you a task to analyse the historical performance of one of those ten blue-chip stocks. You need to utilise a few of the most prominent empirical asset pricing models - the Fama-French Three-Factor Model (Fama and French, 1993); and a newly developed empirical asset model by Fama and French Five-Factor (Fama and French, 2015).
Your manager has asked that each team member is to compare the historical performance of the blue-chip stock assigned to you using econometric analysis.
The Models
Fama-French Three-Factor and Five-Factor Empirical Asset Pricing Models
The Fama-French three-factor (Fama and French, 1993) and five-factor (Fama and French, 2014), empirical asset pricing models described by the following regressions.
Three- Factor Model :
ERt = α + βm(Rm - Rf)t + βsSMBt + βhHMLt + ut
Five- Factor Model :
ERt = α + βm(Rm - Rf)t + βsSMBt + βhHMLt + βRRMWt + βcCMAt + ut
Data
The Excel spreadsheet in the LMS under “Assessments” Block titled ‘FIN5EME-SEM2- 2019_ Assignment_1_DATA’ includes the following historical time series closing prices (endof-the-month) of the ten stocks, excess market returns and some popular risk factors covering
the period from January 1964 to December 2017.
How to select a particular stock of the ten stocks?
The first sheet of this Excel spreadsheet is titled “NYSE Stock Prices”. It contains historical monthly closing prices for ten blue-chip stocks listed on the NYSE. You are assigned to a particular blue-chip stock based on the last digit of your student ID number. For example, if the last digit of your Student ID is ‘1’, you should use the United Technologies (UTX) stock data series ‘1’ which is in column C.
The Sample
Once you have selected your stock based on the last digit of your student ID, then you have to move to compute returns (240 monthly returns) on your assigned stock and will extract this information to use with the data on the second sheet of the Excel spreadsheet titled ‘Market Index_Factors_RF Rate’. It contains the market index data, Fama-French five risk factors and, the risk-free rate. More specifically, these are:
1) Excess return on the market (Rm-Rf) risk factor;
2) Small Minus Big (SMB) risk factor;
3) High Minus Low (HML) risk factor;
4) Robust Minus Weak (RMW) risk factor;
5) Conservative Minus Aggressive (CMA) risk factor; plus
6) The risk-free (Rf) rate measured as the 1-month US T-Bill return.
In this assignment, you have to consider the sample data of 240 months (20 years). The full data set of 648 observations is split into ten sub-periods concerning time. You are assigned to a particular sub-period which corresponds to the second-last digit of your student ID number.
For example, if your second last digit is ‘3’, you should perform an empirical analysis from January 1976 (01/1976) to December 1995 (12/1995), that is, the data segment for the period of 240 monthly observations is set in column ‘E’ and starts from row 147 and finishes at row 386.
Report
In a report, you should provide concise but relevant answers to all the tasks below, including the corresponding EViews output in the appendix except for the graphs or your own constructed tables.
In conducting statistical tests throughout, state all relevant information, such as the null and alternative hypotheses, the distribution used, the level of significance, the decision rule (critical value or p-value) and proper interpretation of your results.
Use the following instructions to finalise your report.
Font: Times New Roman Font Size: 12 Page Size: A4
Line Spacing: Double Form: pdf document
Note: If you selected a wrong company and wrong sampling period, your submission would be subject to a substantial penalty.
You are expected to prepare and submit three separate files with clear identification of your name and student ID in the file name:
1) An Excel file containing your assigned data.
2) An Eviews file containing all estimated descriptive statistics and models.
3) A written report not exceeding 1,000 words of your results from Part (A) and Part (B) including Eviews outputs with tables or figures.
(Hint: Save all files with the file name: “Ass1_FirstName_ID.***”)
Perform the following tasks.
Task 1:
Using data for your sub-period compute the returns (using rt = 100xln(Pt/Pt-1) formula) on your selected NYSE stock and draw the returns histogram with other summary statistics (Figure 1).
Discuss the statistics and the nature of the distribution of returns.
Task 2:
Provide separate time series plots of each of your preferred (i) stock’s price; (ii) returns; and
(iii) squared returns. Briefly describe your findings with the help of results from part 1 above.
(Hint: The squared return time series is used to indicate a price volatility time series).
Task 3:
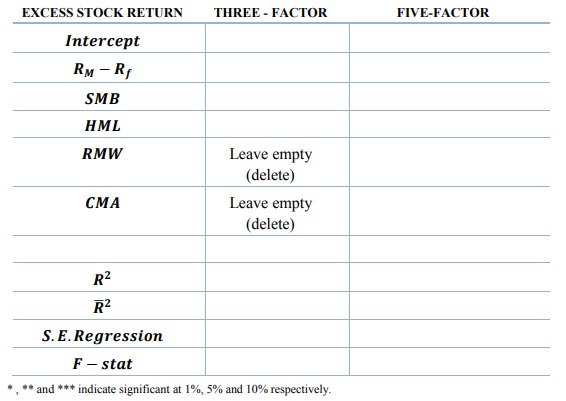
Estimate both models M.1 and M.2 and report results in Table 1 below of both models.
(Please read all the questions below before you fill this table)
Table 1: Regression Results of Fama-French Three- and Five-Factor Models
Task 4:
Test the individual significance of the slopes of the estimated risk factors (Hint: a hypothesis test of the null that the individual slope coefficient is equal to zero (‘0’)).
Task 5:
Perform a test of overall significance (that all the slope coefficients of the estimated risk are jointly equal to zero in each model). Comment on the results.
Task 6:
Perform appropriate tests to detect the problems of Heteroskedasticty and Serial Correlation. Evaluate the result and report your findings with the description of the measure(s) you have taken to correct the problem(s)? Remember that the presence of heteroskedasticity and/or
autocorrelation results in inefficient estimators and your regression results should not include imprecise standard errors.
Task 7:
We observe that M.2 encompasses M.1, that is, M.1 is nested in M.2. What restrictions are required on some of the coefficients of M.2 to obtain M.1? Also, perform a hypothesis test to test the validity of the joint restrictions you have imposed. Which of the two models would you prefer and why? Provide a statistical reason for this answer.
Task 8:
Perform an appropriate hypothesis test to test the normality of the residuals of your proposed model. Is it plausible to assume the normal distribution of errors? In case, if there is evidence against the normal distribution, then what would be the consequences of violation of this
assumption and should we care about them?