Create a new data set

Assignment Help Advanced Statistics
Reference no: EM132206089

You will need to sign into sas studio to complete the homework.

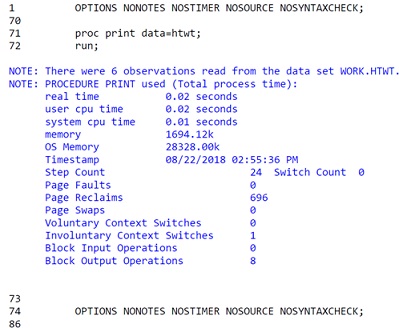
Examine the SAS Log - click on the Log tab - and see that the Print procedure executed

1610_procedure.jpg

Create a scatter diagram with "height" on the horizontal axis and "weight" on the vertical axis

Creating or modifying data sets

To create a new SAS data set from an existing one, or to modify an existing data set, use the SET statement.

Assume that the data set HTWT exists.
To create a new data set called HTWT2 use

Create a new data set from HTWT including only name and sex

Create a new data set called ARITH from HTWT and carry out some operations

data arith; *new data set;
set htwt; *read HTWT;
sum = height + weight; *sum;
diff = height - weight; *difference;
prod = height * weight; *product;
div = height / weight; *division;
power = age**2; *age squared;
sqrt = age**.5; *power 1/2;
recip=age**-1; *power -1;
negage = -age; *minus age;
negage2=-age*2; *minus age times 2;
complex=((height+weight)/age)**2; *inner paren first;
run;

proc print data=arith;
var name age height weight sum diff prod div power sqrt recip
negage negage2 complex;
run;

Create a new data set COMPARE from HTWT

Create a new data set called LOGICAL from COMPARE.

Create a SAS data set FUNCTION from ARITH.

Create a data set containing just males from HTWT.

Create a data set for females.

Combine the data sets MALE and FEMALE into a new data set including all the observations

Create a data set from HTWT and create a new variable ID that is equal to the observation number

Assume the students have been given a test and their ID number and test score have been recorded. Create a data set with these two variables.

Before margining this new data set with HTWT we must sort it according to the matching variable ID

Create a new data set, or modify an existing one, by merging the two data sets using the BY statement to identify the matching variable.

Attachment:- Introducing SAS.rar

Verified Expert

Sas studio has been logged in to study the exercise which needs to be made in the power point where heading has been written as “Introducing SAS”. It requires to present how a SAS program and its structure is created and by showing the process in the ppt along with the running process of SAS program.

Reference no: EM132206089

Questions Cloud

Pseudocode-provide a wgram : Provide a Wgram that will take an infinite amount of inputs and output the minimum value, maximum value, sum and average.
Return the n-th number in the fibonacci sequence : Write a MATLAB script that prompts the user for a positive integer, N and returns the N-th number in the Fibonacci Sequence.
Prompt for user input of an array xin : Write a Matlab script file Check2 that prompts for user input of an array Xin and displays the output array Xout .
Write a method that accepts an array of integers : Write a method called percent Even that accepts an array of integers as a parameter and returns the percentage of even numbers in the array.
Create a new data set : MFE 6390 - Statistics and Econometrics: Theory and Application - Create a new data set, or modify an existing one, by merging the two data sets
Write a matlab script that creates an array with values : Write a Matlab script that creates an array with values -123, -4, 5, 67, 890, and 12345. Print out the array in several formatted ways.
Write a matlab script utilizing an if-else statement : Write a MATLAB script utilizing an IF-ELSE statement that asks for the user to enter a whole number.
Write a matlab script file to perform the task : Name your file Midterm.m and submit to the Midterm dropbox on E360 when complete. Define a vector V=rand(1, 100).
Calculate and print out the squares of all the even integers : Write the MATLAB program using loops required to calculate and print out the squares of all the even integers between 0 and 50.

Reviews

len2206089

1/2/2019 5:01:05 AM

you will need to sign into sas studio to complete the homework. username is password is Beautiful8.Watch and repeat the same exercises as in the PowerPoint lecture "Introducing SAS" located on Blackboard (Learning Modules folder/Introduction to SAS). 3. Save your exercise outputs from point 2 above and submit as a single document (This is your homework for Week 1).

Write a Review

Advanced Statistics Questions & Answers

  Show that ? is a right eigenvector with eigenvalue one

Show that ν is a right eigenvector of [P] with eigenvalue 1. Hint: Redraw Figure 4.5 for multiple recurrent classes and first show that ν is an eigenvector of [Pn] in the limit.

  Show that the steady-state probability of state m

Show that the steady-state probability of state m is k Pr{m} = n pi(mi), i=1 where pi(mi) is the probability of state mi in an (M, M, s) queue.

  Write code that performs simulation

MTH 4135 Homework - Write code that performs this simulation, using each of the following uniform generators - the RANDU generator

  Find the correlation coefficient between x and z

Find the correlation coefficient between X and Z - Consider two independent random variables X and W with identical variance.

  Consensual relationship agreements

Create a counter argument against the use of CRAs in your current (or future) workplace. Discuss the ethical principles involved in the use of CRAs. Create at least one (1) other option besides CRAs that would address workplace romances.

  Question regarding statistical sampling

What are some benefits of an auditor using statistical sampling? What are some examples of statistical sampling? Does anyone have any experience they are willing to share with the class on statistical sampling?

  Write r code in order to compute an approximate matrix

Write R code in order to compute an "approximate" correlation matrix from this data using pairwise deletion method.

  Represent some attributes or variables on a single screen

Our main aim is to represent some attributes or variables on a single screen, so that they can visualise their data on one screen

  Discuss adjusting the population mean

The production manager and the engineers discuss adjusting the population mean and the standard deviation of the length of the pins.

  Description of business research

Of the three research designs types (exploratory, formalized, and casual), which would you use to assess the effectiveness of an aspect of your job? Explain.

  Estimate correlation between the illiteracy and birth rates

Find the estimated probability that a 21-year-old voter will vote for Lopez and compare the odds of support for Lopez between two people that are 10 years apart in age - what age is the estimated probability of a vote for Lopez equal to 0.5?

  Plan the analysis

Plan the analysis

Free Assignment Quote

Assured A++ Grade

Get guaranteed satisfaction & time on delivery in every assignment order you paid with us! We ensure premium quality solution document along with free turntin report!

All rights reserved! Copyrights ©2019-2020 ExpertsMind IT Educational Pvt Ltd