Reference no: EM131146119
Please can you simplify the answers as much as possible.
The shorter and more concise the answer the better. If a particular question involves using a table PLEASE include that table or at least tell me which table was used to get the answer.
Question 1. (a) The serum total cholesterol (STC) level of the UK population aged over 20 is assumed to be normally distributed with a mean of 200 milligrams per decilitre (mg/dL). The population standard deviation is 40 mg/dL. Find
(i) the probability that a randomly selected person has a STC level of 240 mg/dL and above;
(ii) the proportion of the UK population (aged over 20) with a STC level between 180 mg/dL and 210 mg/dL;
(iii) the probability that the mean STC of 16 people exceeds 215 mg/dL.
(b) Data were collected to compare the STC level of people with and without heart disease. The data below were the STC levels from 10 patients with heart disease (the standard deviation of this sample is 7.65 mg/dL)
224 233 210 228 237 226 231 230 228 236
(i) Construct a 95% confidence interval for the mean STC level for the heart disease patients.
(ii) A Minitab summary of data from 10 people without heart disease is given below:
Variable N Mean StDev 95% CI
normal 10 218.00 4.76 (214.59, 221.41)
Interpret the two confidence intervals and comment on the difference in STC level between the two groups of people.
Question 2. (a) One use of the chemical formaldehyde is to preserve animal specimens. However, excessive exposure to formaldehyde is linked to some short-term adverse health effects.
The following are the total amounts of formaldehyde, in mg/mL, that a sample of 10 students in an animal health training centre were exposed to.
7.32 5.57 5.50 9.61 8.52 5.11 6.81 3.63 5.21 8.96
Assuming the data are normally distributed, test at the 5% level whether the mean formaldehyde level is lower than the regulated 8.5 mg/mL level.
(b) Elite distance runners are thought to be thinner than other people. To investigate this, a sport scientist gathered the following data on skinfold thickness of the thigh, an indirect measure of body fat, from 10 elite runners and 10 non-runners in the same age group. Below are the summary statistics of the measurements (unit: mm).
| Group |
Sample size |
Mean |
SD |
| Runners |
10 |
5.54 |
1.75 |
| Non-runners |
10 |
22.33 |
3.39 |
(i) Use an appropriate test at the 5% significance level to compare the variability of the two groups.
(ii) Carry out a two-sample t-test at the 1% significance level to determine whether elite distance runners have a mean skinfold thickness less than that of non-runners. Comment on your answer.
Question 3. (a) The table below presents data from a study which investigates the extent to which children with bronchitis in infancy get more respiratory symptoms in later life.
| Cough at age 14 |
Bronchitis at 5 |
No bronchitis at 5 |
| Yes |
16 |
54 |
| No |
91 |
502 |
Analyse the data using an appropriate hypothesis test. Comment on, at the 5% significance level, if risk of cough at later life is influenced by whether or not children had infant bronchitis.
(b) A study was conducted to determine whether fortifying orange juice with vitamin D would increase serum 25-hydroxyvitamin D (s25D) concentration in the blood. In this study, 7 participants drank fortified orange juice per day and 8 participants drank unfortified orange juice per day. After 7 days, s25D concentration (in nanomoles per litre) was measured and the data are presented as follows
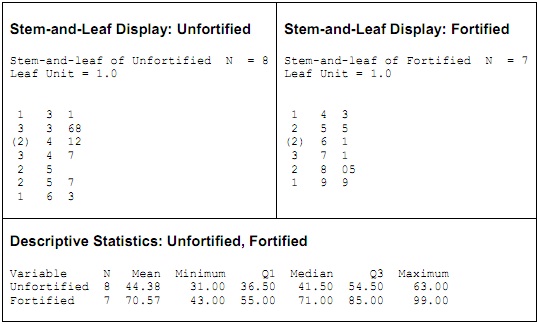
(i) Use the output above to justify why the Mann Whitney U test is the most appropriate test for this set of data.
(ii) Using the two Stem-and-Leaf Displays above reconstruct the actual values serum 25-hydroxyvitamin D(s25D) of the actual concentration and rank them.
(iii) The two postulated hypotheses are :
H0: median s25D concentration for people drinking fortified juice is equal to the median s25D concentration for those drinking unfortified juice
H1: median s25D concentration for people drinking fortified juice is not equal to the median s25D concentration for those drinking unfortified juices.
Given a Mann Whitney test (or Wilcoxon Rank Sum test) test statistic of u=min(UUN, UF )=min(6,50)=6. The critical value is 10 (from Neave table 5.3 with nL = 8, nS = 7 at the 5% level).
Using the observed value and the critical value, carry out the Mann Whitney test, at the 5% significance level, to assess whether there is a difference between the two groups.
Question 4. The table below shows the additional hours (exceeding the standard lifetime of 10,000 hours) of fifteen 60W electric light bulbs from three different brands (five light bulbs from each brand):
| Brand |
Hours in excess of 10,000 |
Row total |
| A |
16 |
15 |
13 |
21 |
15 |
80 |
| B |
18 |
22 |
20 |
16 |
24 |
100 |
| C |
26 |
31 |
24 |
30 |
20 |
131 |
(a) State the equation of a suitable statistical model for analyzing this set of data and the necessary assumptions. Explain carefully all terms in the model equation.
(b) State the necessary condition(s) if the testing was carried out using the completely randomized experimental design.
(c) Carry out the appropriate analysis of variance for this dataset, testing at the 5% significance level whether there exists a difference in mean additional hours (exceeding 10,000) across the three brands. State all hypotheses, calculations and conclusions drawn clearly.
You may assume, in the usual notation, ∑∑y2ij = 6869.
(d) Further analysis in Minitab produced the output below. Explain what this shows.
Question 5. A chemical compound has been developed to reduce the Trihalomethanes (THMs) concentration in normal drinking water. Experiments were carried out to investigate the efficacy of this new compound in reducing the THMs level. Fifteen water samples were treated with this new compound. For each sample, the THMs concentration level, in μg/l, and the applied dosage of this compound, in μg/l, were recorded. A scatterplot from Minitab of the THMs levels and applied dosages is given below.
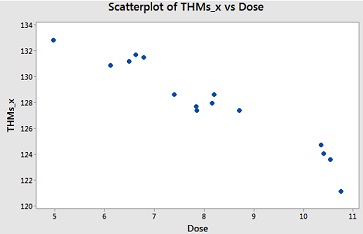
(a) Comment on the scatterplot of the data
(b) Analyses were subsequently carried out on this set of data and presented below is some output from Minitab.
Correlation: THMs_x, Dose
Pearson correlation of THMs_x and Dose = -0.964
P-Value = 0.000
Regression Analysis: THMs_x versus Dose
Model Summary
S R-sq
0.944554 92.89%
Coefficients
Term Coef SE Coef T-Value P-Value
Constant 142.85 1.17 122.18 0.000
Dose -1.844 0.141 -13.03 0.000
(i) Use the value of the correlation coefficient to verify the comments that you have given in (a). Comment on the strength of the association observed between THMs_x, Dose.
(ii) Construct the equation of the regression line and interpret the coefficients.
(iii) Using the output of the regression above, determine the slope and the intercept.