Reference no: EM132459832
Question 1 - A political consultant conducts a survey to determine what position the mayoral candidate she works for should take on a proposed smoking ban in restaurants.
Which of the following survey questions will deliver an unbiased response?
Should the city ban smoking in restaurants to protect our children from second-hand smoke?
Should tobacco smoke, a known cause of lung cancer, be banned from public spaces such as restaurants?
Does the city have the right to restrict recreational activities, such as moderate consumption of alcohol or tobacco, on the premises of privately-owned businesses?
None of the above
Question 2 - The data in the Excel spreadsheet linked below indicate the selling prices of houses located on corner lots ("corner-lot houses") and of houses not located on corner lots.
Conduct a one-sided hypothesis test of the claim that corner-lot houses have higher average selling prices than those located on non-corner lots. Using a 99% confidence level, which of the following statements do the data support?
Upscale, expensive neighborhoods have more street corners.
The average selling price of a corner-lot house is higher than that of the average house not located on a corner lot.
The average selling price of a corner-lot house is no more than that of the average house not located on a corner lot.
There is not enough evidence to support the claim that the average selling price of a corner-lot house is higher than that of the average house not located on a corner lot.
|
Corner-lot
House Price
(in $hundreds)
|
Non-corner Lot
House Price
(in $hundreds)
|
|
2150
|
2050
|
|
1999
|
2080
|
|
1800
|
2150
|
|
1375
|
1900
|
|
1250
|
1560
|
|
1110
|
1450
|
|
1139
|
1449
|
|
995
|
1270
|
|
900
|
1235
|
|
1695
|
1170
|
|
1553
|
1180
|
|
1300
|
1155
|
|
1020
|
995
|
|
1020
|
975
|
|
925
|
975
|
|
725
|
960
|
|
1299
|
860
|
|
1250
|
1250
|
|
1080
|
922
|
|
1050
|
899
|
|
835
|
850
|
|
805
|
876
|
|
750
|
890
|
|
773
|
870
|
|
1295
|
700
|
|
975
|
720
|
|
700
|
720
|
|
2100
|
749
|
|
600
|
731
|
|
1844
|
670
|
|
699
|
2150
|
|
1330
|
1599
|
|
1129
|
1350
|
|
1050
|
1239
|
|
1000
|
1200
|
|
1030
|
1125
|
|
940
|
1100
|
|
874
|
1049
|
|
766
|
955
|
|
739
|
934
|
|
*
|
875
|
|
*
|
889
|
|
*
|
855
|
|
*
|
810
|
|
*
|
799
|
|
*
|
759
|
|
*
|
755
|
|
*
|
750
|
|
*
|
730
|
|
*
|
729
|
|
*
|
710
|
|
*
|
690
|
|
*
|
670
|
|
*
|
619
|
|
*
|
939
|
|
*
|
820
|
|
*
|
780
|
|
*
|
770
|
|
*
|
620
|
|
*
|
540
|
|
*
|
1070
|
|
*
|
725
|
|
*
|
660
|
|
*
|
580
|
|
*
|
1580
|
|
*
|
1160
|
|
*
|
1109
|
|
*
|
1050
|
|
*
|
1045
|
|
*
|
1020
|
|
*
|
975
|
|
*
|
950
|
|
*
|
920
|
|
*
|
945
|
|
*
|
872
|
|
*
|
870
|
|
*
|
869
|
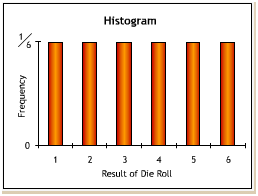
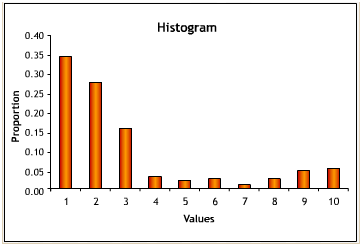
Question 3 - The histogram below shows the underlying distribution pattern of the results of a rolled die. Suppose the die is rolled 50 times and the results are averaged. Suppose this process - rolling 50 dice and averaging their results - is repeated 100 times.
Which of the following best describes the distribution of these 100 averages?
Skewed right
Skewed left
Normal
Uniform
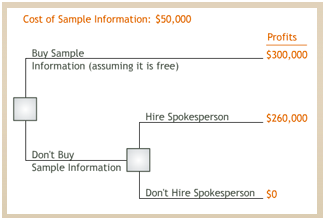
Question 4 - The manager of the Eris Shoe Company must decide whether or not to contract a controversial sports celebrity as its spokesperson. The new spokesperson's value to Eris depends heavily on consumers' perception of him. An initial decision analysis based on available data reveals that the expected monetary value of contracting the new spokesperson is $260,000. For $50,000 Eris can engage a market research firm that will help Eris learn more about how consumers might react to the celebrity. The EMV of buying this sample information (assuming it is free) for this decision is $300,000.
The tree below summarizes Eris's decision. Based on EMV analysis, what should Eris's manager do?
Hire the research firm
Not hire the research firm, but contract the new spokesperson
Not hire the research firm and not contract the new spokesperson
Not enough information to determine the answer
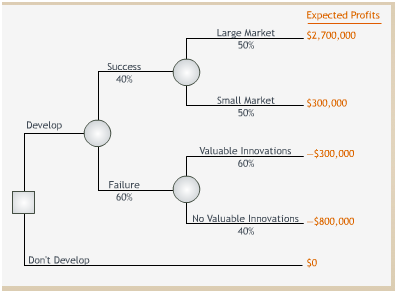
Question 5 - Electronics manufacturer SE must decide whether or not to invest in the development of a new type of battery. If the development succeeds, the market for the battery may be large or small. If it doesn't succeed, the development efforts may or may not generate minor innovations that would offset some of the battery's development costs. The tree below summarizes the decision.
What is the expected monetary value of developing the new battery?
$0.3 million
-$0.5 million
$0.9 million
$1.5 million
Question 6 - The table below displays data the First Bank of Silverhaven (FBS) has collected on the personal savings accounts of its job-holding customers. The table includes data on the distribution of the number of accounts held by Homeowners vs. Non-Homeowners, and by whether the customer is Self-Employed or is Employed by a firm in which he or she does not have an ownership stake.
Which of the following statements is true?
Home ownership and employment status are statistically dependent.
The fact that a given personal account is held by a homeowner tells us nothing about the account holder's employment status.
The fact that a given personal account is held by a self-employed person tells us nothing about the account-holder's home ownership status.
None of the above.
|
Fist Bank of Silverhaven Personal Saving Accounts
|
|
|
Home ownership status
|
|
Homeowner
|
Non- Homeowner
|
|
Employment status
|
Self-employed
|
12%
|
3%
|
|
Employee
|
58%
|
27%
|
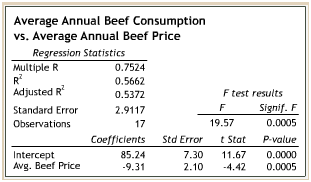
Question 7 - The regression analysis below relates average annual per capita beef consumption (in pounds) and the independent variable "average annual beef price" (in dollars per pound).
What does the coefficient on beef price tell us?
For every price increase of $1, average beef consumption decreases by 9.31 pounds.
For every price increase of $1, average beef consumption increases by 9.31 pounds.
For every price increase $9.31, average beef consumption decreases by 1 pound.
For price increase of $9.31, average beef consumption increases by 1 pound.
|
Beef Consumption
(lbs/capita)
|
Average Beef Price
($/lbs)
|
|
58,6
|
2,99
|
|
59,4
|
2,99
|
|
53,7
|
3,15
|
|
48,1
|
3,55
|
|
49,0
|
3,55
|
|
48,2
|
3,71
|
|
47,9
|
3,61
|
|
46,0
|
3,95
|
|
50,8
|
3,66
|
|
55,2
|
3,51
|
|
52,2
|
4,11
|
|
57,3
|
3,42
|
|
54,4
|
3,65
|
|
53,6
|
3,51
|
|
53,9
|
3,39
|
|
54,2
|
3,17
|
|
60,0
|
2,80
|
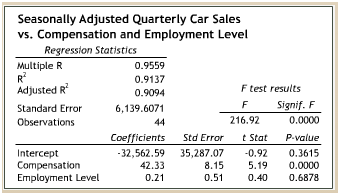
Question 8 - The regression analysis below relates the value of new car sales (in millions of dollars) to compensation (in billions of dollars) and the employment level in the non-agricultural sector (in thousands) for 44 consecutive quarters.
Which of the two independent variables is statistically significant at the 0.05 level?
Compensation only
Employment level only
Both independent variables
Neither independent variable
|
Quarter
|
Seasonally Adjusted New Car Sales ($millions)
|
Compensation
($billions)
|
Employment Level (thousands)
|
|
1
|
46.787
|
1.193,3
|
87.973
|
|
2
|
44.256
|
1.217,3
|
90.021
|
|
3
|
41.523
|
1.254,4
|
90.120
|
|
4
|
42.367
|
1.284,7
|
91.180
|
|
5
|
43.580
|
1.319,8
|
89.832
|
|
6
|
36.392
|
1.335,1
|
90.668
|
|
7
|
38.303
|
1.360,1
|
89.850
|
|
8
|
40.690
|
1.411,6
|
91.276
|
|
9
|
45.653
|
1.451,7
|
89.964
|
|
10
|
42.283
|
1.478,1
|
91.566
|
|
11
|
44.122
|
1.512,6
|
91.405
|
|
12
|
42.022
|
1.530,6
|
91.691
|
|
13
|
45.255
|
1.542,7
|
89.341
|
|
14
|
45.064
|
1.563,9
|
90.310
|
|
15
|
43.560
|
1.579,8
|
89.324
|
|
16
|
48.794
|
1.586,0
|
89.436
|
|
17
|
51.794
|
1.610,7
|
88.815
|
|
18
|
55.270
|
1.643,5
|
89.920
|
|
19
|
54.389
|
1.671,3
|
90.480
|
|
20
|
60.100
|
1.715,4
|
92.367
|
|
21
|
67.741
|
1.755,8
|
91.637
|
|
22
|
69.554
|
1.793,1
|
94.256
|
|
23
|
65.352
|
1.819,5
|
95.021
|
|
24
|
70.472
|
1.847,7
|
96.547
|
|
25
|
76.729
|
1.882,7
|
95.450
|
|
26
|
79.262
|
1.939,8
|
97.657
|
|
27
|
80.554
|
1.976,0
|
97.985
|
|
28
|
74.859
|
2.012,8
|
99.383
|
|
29
|
79.916
|
2.044,1
|
98.213
|
|
30
|
82.091
|
2.069,8
|
99.850
|
|
31
|
87.893
|
2.097,9
|
99.877
|
|
32
|
86.040
|
2.128,4
|
101.169
|
|
33
|
81.814
|
2.163,2
|
99.922
|
|
34
|
84.304
|
2.211,9
|
102.186
|
|
35
|
85.062
|
2.265,1
|
102.657
|
|
36
|
81.125
|
2.325,0
|
104.522
|
|
37
|
92.036
|
2.358,7
|
103.445
|
|
38
|
92.467
|
2.405,6
|
106.050
|
|
39
|
89.461
|
2.452,2
|
105.963
|
|
40
|
91.508
|
2.505,1
|
107.644
|
|
41
|
95.508
|
2.560,7
|
106.425
|
|
42
|
95.871
|
2.572,9
|
108.741
|
|
43
|
96.594
|
2.586,6
|
108.897
|
|
44
|
88.836
|
2.612,7
|
110.260
|
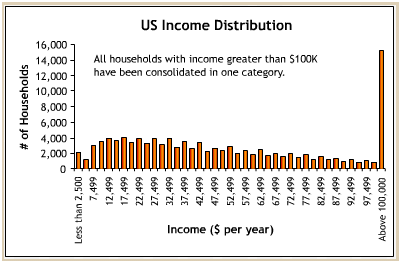
Question 9 - The histogram below displays the distribution of income among households in the United States in 2001. Suppose a researcher takes a random sample of 60 households and calculates average household income in the sample. Suppose 99 other researchers conduct identical studies, each independently collecting a random sample of 60 households and computing the average household income in that sample.
Which of the following best describes the distribution of the 100 different average household incomes calculated by the researchers?
Symmetric with one peak
Symmetric with two peaks
Skewed left
Skewed right
Question 10 - Which of the following correctly ranks from smallest to largest the measures of central tendency of the data displayed in the histogram below?
Mode < mean < median
Median < mode < mean
Mode < median < mean
Not enough information to determine the answer
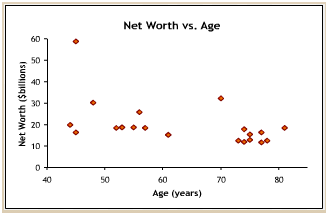
Question 11 - The scatter diagram below displays the relationship between age and net worth (in US$ billions) for the world's 20 wealthiest people as reported by Forbes Magazine in 2001.
If 45-year-old Bill Gates, the world's wealthiest person, is considered an outlier and removed from the data set, what will be the effect on this relationship?
The value of the correlation coefficient will decrease.
The value of the correlation coefficient will increase.
The value of the correlation coefficient will stay about the same.
The correlation will become perfectly linear.
Question 12 - The table below displays data on defect rates at a compact disk (CD) pressing facility. The table includes data on the distribution of CDs that have content errors (missing and/or wrong content), and on the distribution of CDs that have labeling errors.
Which of the following statements is true?
The fact that a CD has a content error tells us nothing about whether it has a labeling error.
The events of a CD having a content error and a CD having a labeling error are statistically dependent.
The fact that a CD has a labeling error tells us something about whether it has a content error.
None of the above.
|
CD printing Defects
|
|
|
Label
|
|
No Labeling Error
|
Labeling Error
|
|
Content
|
No Content Error
|
97.02%
|
1.98%
|
|
Content Error
|
0.98%
|
0.02%
|
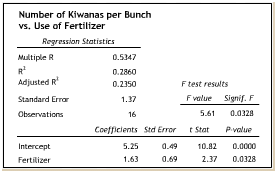
Question 13 - Amalgamated Fruits, Vegetables, and Legumes, an agricultural company, breeds the experimental fruit "kiwana." The company is studying the effects of a new fertilizer on the number of kiwanas per bunch grown on kiwana trees. The regression analysis below relates the number of kiwanas per bunch to the independent dummy variable "fertilizer."
Based on the regression, which of the following statements may be concluded?
On average, the use of the new fertilizer increases the number of kiwanas per bunch by 5.25.
The independent dummy variable "fertilizer" is significant at the 0.01 level.
Variation in the independent dummy variable "fertilizer" explains around 53% of the variation in the number of kiwanas per bunch.
None of the above.
|
Number of kiwanas
per bunch
|
Fertilizer
|
|
4
|
0
|
|
4
|
0
|
|
8
|
0
|
|
5
|
0
|
|
5
|
0
|
|
4
|
0
|
|
8
|
0
|
|
4
|
0
|
|
7
|
1
|
|
6
|
1
|
|
6
|
1
|
|
7
|
1
|
|
8
|
1
|
|
8
|
1
|
|
7
|
1
|
|
6
|
1
|
0 = fertilizer not used
1 = fertilizer used
|
Number of Kiwanas per Bunch vs. Use of Fertilizer
|
|
Regression Statistics
|
|
|
|
|
Multiple R
|
0,5347
|
|
|
|
|
R Square
|
0,2860
|
|
|
|
|
Adjusted R Square
|
0,2350
|
|
F testresults
|
|
Standard Error
|
1,37
|
|
F value
|
Signif. F
|
|
Observations
|
16
|
|
5,61
|
0,0328
|
|
|
|
|
|
|
Coefficients
|
Std Error
|
t Stat
|
P-value
|
|
Intercept
|
5,25
|
0,49
|
10,82
|
0,0000
|
|
Fertilizer
|
1,63
|
0,69
|
2,37
|
0,0328
|
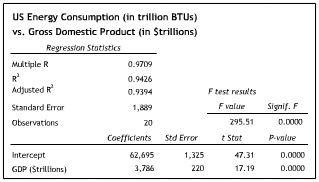
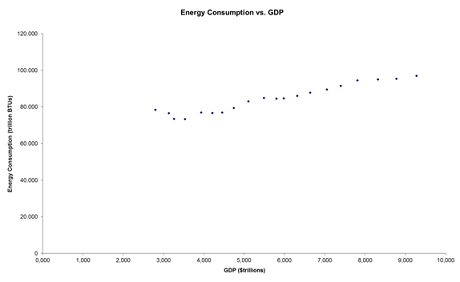
Question 14 - The regression analysis below relates US annual energy consumption in trillions of BTUs to the independent variable "US Gross Domestic Product (GDP) in trillions of dollars."
The coefficient on the independent variable tells us that
for every additional trillion dollars of GDP, average energy consumption increased by 3,786 trillion BTUs.
for every additional dollar of GDP, average energy consumption increased by 3,786 trillion BTUs.
for every additional trillion dollars of GDP, average energy consumption increased by 3,786 BTUs.
for every additional trillion BTUs of energy consumption, average GDP increased by $3,786 trillion.
|
Year
|
GDP
( in $trillions)
|
Energy Consumption (in trillions of BTU)
|
|
1980
|
2,796
|
78.435
|
|
1981
|
3,131
|
76.569
|
|
1982
|
3,259
|
73.441
|
|
1983
|
3,535
|
73.317
|
|
1984
|
3,933
|
76.972
|
|
1985
|
4,213
|
76.705
|
|
1986
|
4,453
|
76.974
|
|
1987
|
4,743
|
79.481
|
|
1988
|
5,108
|
82.994
|
|
1989
|
5,489
|
84.926
|
|
1990
|
5,803
|
84.567
|
|
1991
|
5,986
|
84.640
|
|
1992
|
6,319
|
86.051
|
|
1993
|
6,642
|
87.780
|
|
1994
|
7,054
|
89.571
|
|
1995
|
7,401
|
91.501
|
|
1996
|
7,813
|
94.521
|
|
1997
|
8,318
|
94.969
|
|
1998
|
8,782
|
95.338
|
|
1999
|
9,274
|
96.968
|
Question 15 - In a finance course at a business school, 6 students are randomly selected. Their mean score on the final exam is 75, with standard deviation 8.
What is the 95% confidence interval for the average class score on the final?
[66.6, 83.4]
[67.6, 82.4]
[68.6, 81.4]
[71.7, 78.3]
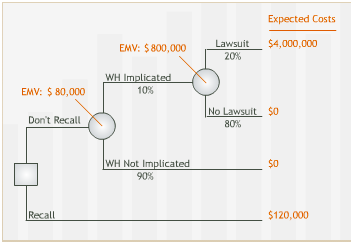
Question 16 - The WH meat-packing company must decide whether or not to recall one week's production of kielbasa due to possible contamination. An outbreak of non-fatal food poisoning may be linked to WH. If so, WH may face a lawsuit. The tree below summarizes the decision.
The EMV of the cost of not issuing a recall is $80,000. Suppose there were a way to know for certain whether WH would be implicated or not. What would be the value of this perfect information?
$68,000
$12,000
$80,000
None of the above
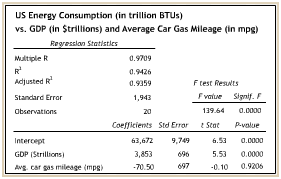
Question 17 - The regression analysis below relates US annual energy consumption in trillions of BTUs to the independent variables "US Gross Domestic Product (GDP) in trillions of dollars" and "average gas mileage of all passenger cars in miles per gallon (mpg)."
The coefficient for the independent variable "average car gas mileage (mpg)," -70.50, describes
the relationship between energy consumption and average car gas mileage, controlling for GDP.
the relationship between energy consumption and average car gas mileage, not controlling for GDP.
the relationship between average car gas mileage and GDP, controlling for energy consumption.
the relationship between average car gas mileage and GDP, not controlling for energy consumption.
|
Year
|
GDP
(in $trillions)
|
Car Gas Mileage (in mpg)
|
Energy Consumption
( in trillions of BTU)
|
|
1980
|
2,796
|
16
|
78.435
|
|
1981
|
3,131
|
16,5
|
76.569
|
|
1982
|
3,259
|
16,9
|
73.441
|
|
1983
|
3,535
|
17,1
|
73.317
|
|
1984
|
3,933
|
17,4
|
76.972
|
|
1985
|
4,213
|
17,5
|
76.705
|
|
1986
|
4,453
|
17,4
|
76.974
|
|
1987
|
4,743
|
18
|
79.481
|
|
1988
|
5,108
|
18,8
|
82.994
|
|
1989
|
5,489
|
19
|
84.926
|
|
1990
|
5,803
|
20,2
|
84.567
|
|
1991
|
5,986
|
21,1
|
84.640
|
|
1992
|
6,319
|
21
|
86.051
|
|
1993
|
6,642
|
20,5
|
87.780
|
|
1994
|
7,054
|
20,7
|
89.571
|
|
1995
|
7,401
|
21,1
|
91.501
|
|
1996
|
7,813
|
21,2
|
94.521
|
|
1997
|
8,318
|
21,5
|
94.969
|
|
1998
|
8,782
|
21,6
|
95.338
|
|
1999
|
9,274
|
21,4
|
96.968
|
Question 18 - The table below displays a week's worth of data on daily sales at the Crank It Louder Music Store.
Over that time period, what was the median daily level of sales?
$1,643.23
$3,489.79
$3,130.46
$800.12
|
Day
|
Sales (in $)
|
|
Monday
|
80.43
|
|
Tuesday
|
835.88
|
|
Wednesday
|
1,643.23
|
|
Thursday
|
800.12
|
|
Friday
|
4,617.69
|
|
Saturday
|
9,002.17
|
|
Sunday
|
7,449.02
|