Reference no: EM131468073
Homework Assignment -
Exercise 1 - Studying DLC flow and error control performance
Situation
Bit Error Rate (BER) can significantly affect the achievable utilization of a link. For a 100-mile T1 link, what is the "tolerable" bit error rate for Stop-and-Wait (SAW) and Sliding Window (SW) DLC flow and error control given frame sizes of 64 bytes and 1500 bytes? For SW, consider both Go-Back-N (GBN) and Selective Reject (SR) Automatic Repeat Request (ARQ) methods.
Requirements
Compute the link utilization, U, for a range of BER for SAW, SW-GBN, and SW-SR for the link configuration described in the Situation above. An interesting range of BER is from 10-3 (a very high bit error rate) to 10-10 (a very low bit error rate). Gain some insights from the numerical results and make a recommendation on the tolerable BER for the link in question. A key assumption for the DLC utilization formulas derived in [1] is that bit errors are independent. It is also assumed that ACK and NACK frames are never in error. If one or both of these assumptions are invalid, how are the results (and the recommendation) affected?
Guidelines and hints
Using the dlc.c tool (from [2]) compute U values for the above described link for BER of 10-3, 10-4, ..., 10-10. Consider a range of SW window sizes. Plot the results using a spreadsheet. Make a conclusion (i.e., a recommendation) based on the insights derived from the graph. Note that a T1 link date rate is 1.544-Mbps (full-duplex) and there are 1609 meters in a mile.
References
[1] W. Stallings, Data and Computer Communications, Sixth Edition. Prentice-Hall, Upper-Saddle River, New Jersey, 1999.
Exercise 2 - Studying the effects of frame length in Ethernet
Situation
CSMA/CD Ethernet is widely believed to support a maximum throughput (throughput is effectively the same as link utilization, U) of no more than 30%. In other words, it is believed that an Ethernet is saturated at 30% utilization. In this exercise the origins of the 30% "myth" are studied.
Requirements
Compute the link utilization, U, for a range of Ethernet bus lengths, frame sizes, and number of stations. Fix the data rate to 10-Mbps with a range of frame lengths from 64 to 1500 bytes and a bus length of no greater than 2·Tpr bit times for a minimum 64 byte frame length (and a date rate of 10-Mbps and 2 · 108 meters/sec signal propagation). Frame preamble and inter frame gap can be neglected to simplify the analysis. Determine, 1) why it is believed that an Ethernet saturates at 30% utilization, and 2) why it is probably more reasonable to believe that throughputs of higher than 30% can be achieved. It has been shown that the Binary Exponential Back off (BEB) arbitration algorithm tends to allow a single station to transmit large numbers of consecutive frames without interference from other stations. This is called the "capture effect" and is studied in [1]. How does the capture effect change the U value?
Guidelines and hints
Using the ether.c tool (from [2]) compute U values for the a 10-Mbps CSMA/CD Ethernet. The formula implemented in ether.c (and also derived in [3]) comes from the original paper describing Ethernet (see [4]). In [5] a seminal experimental study showed that a 10-Mbps Ethernet can support sustained throughputs of much greater than 3-Mbps (or 30% utilization).
References
[1] M. Molle and K. Christensen, "The Effects of Controlling Capture on Multimedia Traffic for Shared Ethernet Systems," Journal of Telecommunication Systems, Vol. 9, No. 3-4, pp. 287 - 314, September 1998.
[2] W. Stallings, Data and Computer Communications, Sixth Edition. Prentice-Hall, Upper-Saddle River, New Jersey, 1999.
[3] R. Metcalfe and D. Boggs, "Ethernet: Distributed Packet Switching for Local Computer Networks," Communications of the ACM, Vol. 19, No. 7, pp. 395 - 404, July 1976.
[4] D. Boggs, J. Mogul, and C. Kent, "Measured Capacity of an Ethernet: Myths and Reality," Proceedings of ACM SIGCOMM '88, pp. 222 - 234, August 1988.
Exercise 3 - Studying the effects of early token release (ETR) in Token Ring
Situation
Early Token Release (ETR) was first implemented in 16-Mbps IEEE 802.5 Token Ring; the original 4-Mbps standard only supported Normal Token Release (NTR). For what configurations (ring length, number of stations, and frame size) does ETR offer performance benefits over NTR?
Requirements
Quantify the performance benefits (i.e., improved utilization, U) of ETR over NTR for 16-Mbps Token Ring.
Guidelines and hints
Using the token.c tool (from [1]) study U values for ETR versus NTR over reasonable ranges of ring length, number of stations, and frame size. For example, fix the number of stations and then vary the ring length and frame size as dependent variables and solve for U as the independent variable. Plot the results using a spreadsheet. Make a conclusion on the value of ETR to Token Ring performance.
The tool token.c implements the utilization formulas derived in [2]. There is a key assumption to these formulas which must be understood when making conclusions on the performance of ETR versus NTR. Carefully, review the derivation of these formulas in [2]. Reference [3] contains a more advanced performance evaluation of the token ring protocol that removes this assumption.
References
[1] W. Stallings, Data and Computer Communications, Sixth Edition. Prentice-Hall, Upper-Saddle River, New Jersey, 1999.
[2] A. Sethi and T. Saydam, "Performance Analysis of Token Ring Local Area Networks," Computer Networks and ISDN Systems, Vol. 9, No. 3, pp. 191 - 200, March 1985.
Exercise 4 - Studying Markov chains and their solution as a set of equations
Situation
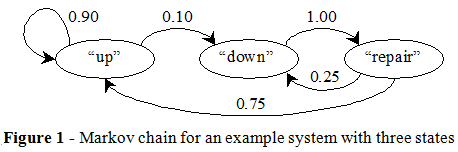
Systems of state where the probability of transition to a next state at discrete time interval is dependent only on the current state (and thus independent of previous states) are called discrete Markovian systems. An example of such a system is a network with three states, "up", "down", and "under repair" where the transition probabilities between the states are defined, for example, at hourly time periods are known and are all independent. It is desirable to know the steady state (i.e., long term) probability for each of the states of such a system. These steady state probabilities, , can be found by solving the probability matrix, P, for the system. An iterative method can be used to solve for a P matrix given an initial guess for (see, for example, [1]).
Requirements
The requirement for this exercise is to solve for the steady state probability for each state for the system of figure 1 (figure 1 show the states and transition probabilities).
Guidelines and hints
For the system of Figure 1 a simple 3 x 3 probability matrix, P, can be constructed and solved (for the steady state probabilities ) where . The tool iter.c (available at [2]) can be used to solved for . The true power of iter.c is in solving for large and sparse P matrices (i.e., P matrices where the majority of the elements are zero).
References
[1] L. Kleinrock, Queueing Theory: Theory, Volume 1. John Wiley & Sons, New York, 1975.
Exercise 5 - Studying the effects of second moment on queueing delay
Situation
Queueing systems can be used to model computer networks. Queueing systems can be analyzed using analytical and simulation methods. Some knowledge of queueing theory is important for anyone doing serious research in the area of computer networks. The queueing delay, or residence time, of a single-server queue is the sum of the waiting time in the queue plus the service time. An important result is that the mean delay of a queue is highly dependent on the second moment (variance) of the interarrival time of arriving jobs (e.g., packets in a computer network). "Bursty" traffic has a high second moment, "smooth" traffic has a low second moment. In this exercise the mean delay of a single server queue with infinite buffer capacity and deterministic service time is compared given arrivals of increasing burstiness.
Requirements
Compare the mean queueing delay (or mean residence time) of an H2/D/1 queue with a service time of 1 second for a range of utilization values (e.g., from 10% to 90% in steps of 10%) and degrees of burstiness as measured by the Coefficient of Variation (CoV) (e.g., from 1 to 5 in steps of 1). The CoV of a time series is the standard deviation (e.g., of counts or interarrival times) divided by the mean. Make a conclusion on the relative and absolute effects of an increasing CoV on mean queueing delay.
Guidelines and hints
An H2/D/1 queue is a single server queue (the "1") with deterministic service times (the "D/") and hyperexponential interarrival times (the "H2/"). Reference [1] is the classic text for queueing theory. Reference [2] contains an excellent summary of key results from queueing theory. The h2d1.c tool from [3] (derived from a simulation program in [4]) is a simulation model of an H2/D/1 queue. Utilization is the ratio of service time to interarrival time (i.e., using the notation from h2d1.c, U = Ts / Ta). The utilization can be set by fixing the service time (Ts) to 1.0 and then varying the interarrival time (Ta) in h2d1.c. For a CoV of 1.0, the H2/D/1 is equivalent to an M/D/1 queue.
References
[1] L. Kleinrock, Queueing Theory: Theory, Volume 1. John Wiley & Sons, New York, 1975.
[2] R. Jain, The Art of Computer Systems Performance Analysis. John Wiley & Sons, Inc., New York, 1991.
[3] M. MacDougall, Simulating Computer Systems: Techniques and Tools. MIT Press, Cambridge, Massachusetts, 1987.
Exercise 6 - Studying the effects of traffic shifts on LRD statistics
Situation
Exercise #6 reproduced the famous "self similar" Bellcore traffic study. Following the publication of [1], many researchers questioned if network traffic is truly self-similar or if underlying non-stochastic (e.g., daily trend) phenomena may be affecting analysis results. A very mathematical treatment of this issue can be found in [2]. In this exercise, a synthetic traffic file will be analyzed for self-similarity where the file will contain a predictable shift in traffic intensity.
Requirements
The requirement for this exercise is to find the Hurst parameter, H, for a synthetically generated traffic file containing a shift in intensity. Generate a traffic file with about 50 seconds of exponentially distributed values with arrival rate (?) of 100.0 and another file with about 50 seconds of exponentially distributed values with arrival rate of 200.0. Append the second file to the end of the first file (e.g., by using a text editor) simulating a traffic intensity shift occurring at about time = 50 seconds. Determine the Hurst parameter for the resulting combined file. Analyze packet counts (i.e., the same as in exercise #6).
Guidelines and hints
For this exercise the following tools (from [3]) are needed: genexp.c, ttoc2.c, block.c, and hurst.c. The tools, mean.c, var.c, cov.c, and autoc.c can also be useful in studying the traffic files. See Exercise #6, Guidelines and hints, for a discussion of how the Hurst parameter can be estimated.
References
[1] W. Leland, M. Taqqu, W. Willinger, and D. Wilson, "On the Self-Similar Nature of Ethernet Traffic (Extended Version)," IEEE/ACM Transactions on Networking, Vol. 2, No. 1, pp. 1 - 15, February 1994.
[2] N. Duffield, J. Lewis, N. O'Connell, R. Russell, and F. Toomey, "Statistical Issues Raised by the Bellcore Data," Proceedings of 11th IEE UK Teletraffic Symposium, Cambridge, 1994.
Exercise 7 - Analysis of collected round-trip delay "ping" data
Situation
Network round-trip times can easily be measured using the ping program found on Windows and Unix systems. The ping program sends a packet to a remote host which then returns the packet (via an echo service) to the sending host. The round-trip time is measured. Are network delays self-similar? A study reported in [1] suggests that they may be.
Requirements
The requirement for this exercise is to collect network round-trip delay data and determine its characteristics including mean, variance, autocorrelation, and Hurst parameter.
Guidelines and hints
The ping utility can be used to collect the round trip data. A "large number" of values must be collected for a good analysis. For example, 10,000 round trip delay with one second between each measurement may be a sufficient number of values. It may also be interesting to compare the delay characteristics of a long (e.g., overseas) versus short network path. The programs mean.c, var.c, autoc.c, block.c, and hurst.c from [2] can be used to characterize the collected data. See Exercise #6, Guidelines and hints, for a discussion of how the Hurst parameter is estimated.
References
[1] M. Orella, S. Uldag, G. Brewster, and I. Sidhu, "Self-Similarity of Internet Packet Delays," Proceedings of the IEEE International Conference on Communications, pp. 513 - 517, 1997.
Attachment:- Assignment File.rar