Reference no: EM132318533
Analyse and solve engineering problem
Learning Outcomes:
L1 Identify the relevance of mathematical methods to a variety of conceptualized engineering examples.
L2 Investigate applications of statistical techniques to interpret, organize and present data by using appropriate computer software packages.
Assignment Brief and Guidance:
Purpose:
The aim of this unit is to develop students' skills in the mathematical principles and theories that underpin the engineering curriculum. Students will be introduced to mathematical methods and statistical techniques in order to analyse and solve problems within an engineering context.
Secnario:
You work as an engineer in a company that is interested in setting quality and production standards for different factories so you have to collect a large number of data from the different work points and analyze these data and then use the results obtained to evaluate these establishments and present these results in a manner appropriate to consumers and investors.
Section 1:
1.1 Dynamic viscosity μ quantifies a fluid's resistance to flow. In laminar flow along a pipe, it is found by the equation:
dynamic viscosity(µ) = shear stress/velocity gradient
Obtain the dimensions and SI units for dynamic viscosity using dimensional analysis, given that:
shear stress = force/area and
velocity gradient = change in velocity/change In length
Applying dimensional analysis find the dimension of the dynamic viscosity.
2.1 When oil flows throgh a pipe because of friction at the walls of the tube, the velocity of the oil is greatest along the central axis of the tube and decreases as the distance from the axis increases until v becomes 0 at the wall. The relationship between v and r is given by the law of laminar flow discovered by the French physician Jean¬Louis-Marie Poiseuille . This law states that
v = p/4µl ( R2 - r2)
Where P is the pressure, and µ is the dynamic viscosity, and I is the length of the tube, and R is the radious of the tube, and r is the radious at which the vilocity is determined.
Apply dimensional analysis to show that this equation is dimensionally consistent.
3.1 Take Δx is the distance and v is the vilocity and a is the acciliration and t is the time and p is the density and P is the pressure. Check for the dimentional consistency of the following
3.1.1 v = v02 + at were v0, is the initial vilocity
3.1.2 v2 - v02 = 2a(Δx)
3.1.3 P + 1/2ρv2 + ρgh = const
3.1.4 vt = √2mg/kρA where A represent the area and k is dimentionless constant
4.1 The period T of a simple pendulum my depend on mass M and length L and the acceleration of the gravity g. if the period, T , can be given as
T = kLxMygz
Use the dimensional analysis to determine x, y, z and hence derive an equation for T, in terms of L, M and g
Section 2:
2.1 You are specifying a drill for use in the manufacture of a new engine part. It will be used to produce a range of hole diameters from 6mm to 25 mm. the drill spindle speed is related to the hole size using the equaction:
N = 1000s/ΠD
where N is the spindle speed in rev/min, s is the cutting speed in mimin and D is the hole diameter in mm Using a cutting speed of 20 m/min, generate the seven spindle speeds
2.1.1 if the spindle speeds are arranged in an arithmetic progression
2.1.2 if the spindle speeds are arranged in a geometric progression.
2.2 Let R = the future value of the investment/loan, including interest
P = the principal investment amount (the Initial deposit or loan amount)
α= the annual interest rate (decimal)
n = the number of times that interest is compounded per year
t = the number of years the money is invested or borrowed for
2.2.1 Find the future value of the investment (R) at the end of the first , second ,third, (t)th year as the interest is compounded one time In the year and what do we call this (sequence)
2.2.2 Rewrite the formula if the interest is compounded each 6 months, 4 months, 3 months, each month, eath day, each (n)times
2.2.3 If we know that limn→∞ (1 + 1/n)n = e prove that
limn→0 (1 + n)1/n = e
And depending on this previous discussion conclude that formula R when the interest is compounded continuously bicomes
R = peαt
Section 3:
3.1 Determine the value of x in each of the following cases In figure 2:
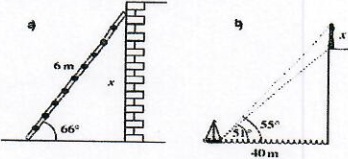
Figure 1
3.2 A crane consists of an inclined jibBC = 6.0 in, a vertical part AB = 2.0 in, and a tie AC = 5.0 m. Find angle A.and find the radius of the circumcircle and the incircie
3.3 An alternating current a = 18sin(120Πt + 0.52),( i in mA). Determine
3.3.1 The amplitude, period, frequency and phase (in degrees) of i.
3.3.2 the value of current when t = 0
3.3.3 the time t when current iis first a maximum.
3.3.4 The time when the current is first 15 mA
3.3.5 Sketch one complete cycle of the waveform i = 18sin(120Πt + 0.52) showing the information calculated in parts (i) to (iv).
3.4 The velocity, of a vehicle during the application of brakes according to time t is given by v = 10e-kt where is a friction constant of the brakes. At t = 30s the velocity is reduced to 2.5 m/s. Determine the constant K.
Section 4:
Reduction into linear form
4.1 An electronic device gives the values of voltage, v, and current, i, shown in Table 4:
Table 1:
| V(volts) |
1 |
2 |
4 |
6 |
8 |
10 |
| i(mA) |
0.5 |
1 |
3.1 |
4.5 |
5.9 |
7 |
Assume that the device obeys the law i = kVn where k and n are constants. By plotting log(v) versus log(i), determine the values of k and n.
4.2 A gas in a cylinder expands according to the lawPVn = C where P is pressure, V is volume and C, n are constants. An experiment produces the results shown in Table 5:
| P(KN/m2) |
100 |
200 |
300 |
400
|
500
|
600
|
| V(m3) |
0.160
|
.001 |
0.076 |
0.063
|
0.053 |
0.048
|
Table 2
Determine the relationship between P and V.
Section 5:
5.1 The hyperbolic functions satisfy a number of identities that are similar to well-known trigonometric identities.
Evaluate, correct to three d.p. sinh(2.1), tanh(1), cosh(0.3), cosh(15)
tanh(5000), tanh(106), sinh(0.01) and sinh(10-6) . and sketch the graph of the functions sinh(x), cosh(x), tanh(x), coth(x)
5.2 The hyperbolic functions are formed by taking combinations of the two exponential functions ex and e-x the logarithmic function is the 'flyers function of exponential function. Determine the relationship between arcsinh(x) and logarithmic function by proving the identity
arcsinivc = ln(x + √1 + x2)
5.3 In a semiconductor, a force, F, exerted on an electron is given by
F = Qcke-kx(1 + e-kx)2
where c and k are constants, x is the distance from the pn junction and Q is charge. Determine the force F by using hyperbolic function
6.3 A transmission line of length L has current Ix at a distance x from the sending end given by
Ix = ((V/Z + I)/2)eyx - (V/Z -I/2)e-yx
where v is the receiving end voltage, I is the receiving end current, z is the characteristic impedance and is the propagation coefficient. for X L determine IL by using hyperbolic form
7.3 The current along a transmission line is given by the following hyperbolic equations. Determine A and B
7.3.1 Aex + Be-x = 4coshx 5sinhx
7.3.2 ex - 3e-x = A sinhx + Bcoshx
Section 6:
6.1 The The heights, in m, of 40 students are shown below:
Table 3
| 1.68 |
1.67 |
1.53 |
1.7 |
1.69 |
1.71 |
1.71 |
1.8 |
1.81 |
1.85 |
| 1.76 |
1.66 |
1.91 |
1.95 |
1.87 |
1.8 |
1.82 |
1.76 |
1.84 |
1.55 |
| 1.61 |
1.85 |
1.93 |
1.88 |
1.95 |
1.57 |
1.97 |
1.56 |
1.99 |
1.83 |
| 1.74 |
1.83 |
1.86 |
1.88 |
1.93 |
1.64 |
1.89 |
1.09 |
1.72 |
1.95 |
6.1 Construct a frequency distribution with an equal class width of 0.1,
6.2 Draw the histogram of this data and draw the frequency polygon
6.3 Calculate the mean and the standared deviation.
6.2 A Goods-In department measures a sample of 50 resistors from a batch which claims that they are all 10 KΩ? The data is displayed in a frequency distribution table 6 as follows:
Table 4
|
Resistance R
|
Frequency
|
|
9.65 R <9.7
|
1
|
|
9.75 R <9.8
|
2
|
|
9.85 R <9.9
|
5
|
|
9.95 R <10.0
|
17
|
|
10.05 R <10.1
|
18
|
|
10.15 R <10.2
|
5
|
|
10.25 R <10.3
|
1
|
|
10.35 R <10.4
|
1
|
6.2.1 Estimate the mean, without evaluating it.
6.2.2 Do you think this data will have a large SD or a small SD?
6.2.3 Calculate the actual mean and standard deviation.
6.2.4 Present the prevous information as a histogram and frequency polygone.
6.3 The next table 7, shows the grades for ten student in Mathematic and Fluid mechanics
Table 5
|
Math(X)
|
91
|
66
|
96
|
66
|
91
|
83
|
55
|
93
|
50
|
70
|
|
Flued(Y)
|
90
|
62
|
85
|
75
|
87
|
75
|
55
|
83
|
56
|
64
|
6.3.1 Find g, y, ax, ay, axy
6.3.2 Piot the data on XY plane
6.3.3 Ditrmine Pearson's correlation coefficient and what its kind and how does it interpret the results
6.3.4 Plot the Linear regression on the same graph
6.3.5 What is he expected grade of math for a student has got 69 in flued
6.3.6 What is he expected grade of Ned for a student has got 78in math
6.4 In probability theory and statistics, a probability distribution is a mathematical function that provides the probabilities of occurrence of different possible outcomes in an experiment.
6.4.1 On average, 7% of the motors produced by a machine are faulty. A random sample of 5 motors is selected from a large batch so that the probability remains constant. Calculate the probabilities that
i. No motor is faulty ii. 1 motor is faulty iii. 2 motor are faulty
iv. 2 motor are faulty v. 2 motor are faulty vi. 2 motor are faulty
And find the expected value of the random variable
6.4.2 The probability of a traffic accident at the cross of a road is If X is P = 1 x 10⁻³, if 600 cars cross throgh that cross road calculate (to 4 d.p.)
i. The probability of no car accedent in that day
ii. The probability of one car accedent
iii. The probability of two cars accedent
iv. The probability of three cars accedent
The Poisson distribution is described by
P(X = x) = e-nP(np)x/x!
i. For this distribution, evaluate (consider the above values of n and p) the previous probabilities. What do you notice about the results?
ii. What is the deffirence between the motors problem and the cars accedent problem, and if we say that the Poisson distrebution is more suitable than bionomial distribution for the car accedent problem, explane why?
6.5 The resistance values of(1 x 10³)Ω resistors in a batch follow a normal distribution with a mean of and a standard deviation of 100Ω. calculate the probability of a resistor having a resistance of
6.5.1 More than 1.2 x 10³Ω
6.5.2 Les than 0.8 x 10³Ω
6.5.3 between 0.9 x 10³ Ω and 1.1 x 10³Ω and make a graph for each one