Reference no: EM1383296
Problem 1
1. There is a formula for sample size n with given margin of error m and con�dence level C for population proportion.
n = 1/4 (z*/m)2
What assumption is made for 1/4 in the formula above? Please give a 1-2 sentences brief explanation to your choice.
(a). Random guess
(b). Assume sample proportion in the future is 1/2
(c). m is half the length of con�dence interval
2. Which one is NOT a linear regression models? Please give a 1-2 sentences brief explanation to your choice.
(a). yi = �0 + exp (�β1xi) + ∈�i, i = 1, 2,........, n
(b). yi = ��β0 + �β1xi+ �β2xi2 + ∈�i, i = 1, 2,........, n
(c). yi = ��β0 exp(xi) + �β2xi7 + ∈�i, i = 1, 2,........, n
3. Suppose X and Y has linear correlation coe�cient r = 0:5, and there are 77 observations, what is the test statistic for the hypothesis test
H0:β1= 0 vs Ha:β1≠ 0
where �1 comes from the simple linear regression model below? Please give a 1-2 sentences brief explanation to your choice.
Y = �β0 + �β1+ �∈
(a). Not enough information
(b). 5
(c). 0.25
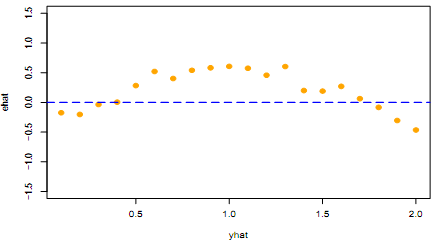
4. What can you see from the graph above? Please give a 1-2 sentences brief explanation to your choice.
(a). None-constant variance
(b). Dependent error terms
(c). None-linearity
5. Which model is more possible to have smaller R2? Please give a 1-2 sentences brief explanation to your choice.
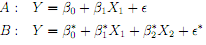
where Y and X1 in model A and B are the same.
(a). Not enough information
(b). Model A
(c). Model B
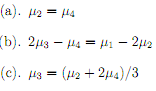
6. Suppose we have designed an experiment to compare the 5 di�erent treatment on the weight gain of rat's liver, and �i is the population mean of the weight gain of rats under treatment i. Which one below is not a contrast? Please give a 1-2 sentences brief explanation to your choice.
Problem 2
Suppose we have a partial R output below. Please answer the questions and show your steps.
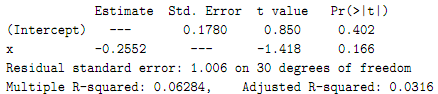
(a). What is the SSE of the model?
(b). What is the linear correlation coe�cient between x and y?
(c). Suppose we know � y is 1.44, what is � x?
(d). Find the P-value for H0 : �1 = 0:5 vs: Ha : �1 < 0:5.
(e). What is the 95% CI for the ^ y at x = 3?
(f). Basing on the output, can you give a reasonable guess of the probability that the y at x = 2 is larger than 0:2.
Problem 3
For example, if Y is annual income ($1000/year), X1 is educational level (number of years of schooling), X2 is number of years of work experience, and X3 is gender (X3 = 0 is male, X3 = 1 is female), then after a linear regression of the data collected and assume the estimated parameters are the true values, then we have
Y = 15 + 0:8X1 + 0:5X2 - 3X3 + �ε
(a). What is the average di�erence of annual income between women and men if their other conditions are the same?
(b). What is the average annual income of a female with 10 years of eduction and 10 years of working experience? What about a male of the same condition?
(c). What is the probability that a female with 16 years education and no work experience will earn more than $30,000/year?
(d). Suppose a female has 15 years of education, and she has 4 years of working experience, how many more years of working experience will make her expected annual income is no less than $28,000?
Problem 4
A �sheries biologist is interested in determining a set of optimal conditions for growing hatchery trout. The two factors that are most easily controlled at the hatchery are water temperature (A) and fungicide (B). The biologist designs an experiment consisting of 2 di�erent water temperatures, 3 di�erent levels of fungicide, and 5 observations on each of the temperature-fungicide combinations. The following summary data resulted on the response variable y= weight of a hatchery trout.
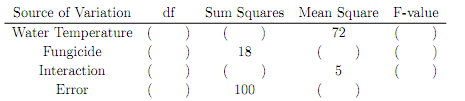
(a). Filling in the missing entries above.
(b). Test for the null hypothesis of no interaction between water temperature and level of fungicide. If appropriate, perform tests of the main e�ects for the two factors: Water Temperature and Fungicide as well. Use signi�cance level � = 5%.
(c). What conclusion you will make basing on the analysis on part (b).
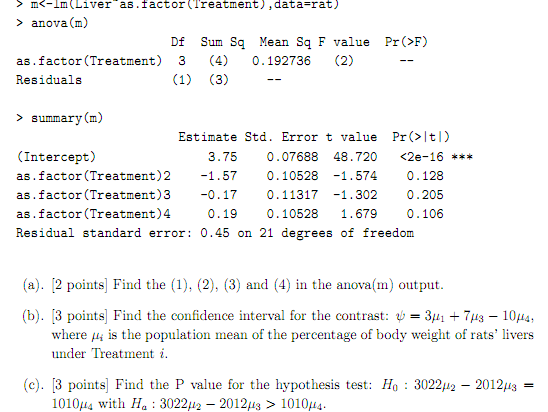
Problem 5
Rats were given one of four di�erent diets at random, and the response measure was liver weight as a percentage of body weight. There are 5 observations for Treatment 1, 6 for Treatment 2, 6 for Treatment 3 and 8 for Treatment 4. Below are the some R output of the analysis:
Problem 6
Using the data in `P6 data.txt' with a single response Y and three predictors X1, X2 and X3.
(a). Perform the backward and forward variable selection procedure using AIC as the criterion for this data set. Please report your �nal models �rst, then show your R commands and related outputs.
(b). In this speci�c case, which variable selection procedure (backward or forward) is better? Why?
(c). Find the AIC, BIC and Cp for the model lm(Y � X1 + X3).
Problem 7
Pine oleoresin is obtained by tapping the trunks of pine trees. Tapping is done by cutting a hole in the bark and collecting the resin that oozes out. This experiment compares four shapes for the holes and the e�cacy of acid treating the holes. Twenty- four pine trees are selected at random from a plantation, and the 24 trees are assigned at random to the eight combinations of whole shape (circular, diagonal slash, check, rectangular) and acid treatment (yes or no). The response (y) is total grams of resin collected from the hole. Data is available in `resin.csv'.
(a). Summarize the data graphically (interaction plots and pro�le plots) and tell what you can see from the graphs.
(b). Build up a two-way ANOVA analysis containing all the main e�ects and the interaction e�ects. Are all the e�ects are signi�cant?
(c). If some e�ects are not signi�cant, what does that mean? Please show how to understand the p-value in the �rst row of your ANOVA table. I
know you can �nd the general answer for it somewhere, and it is not good enough since I need you to specify your understanding on this speci�c case (the speci�c test, speci�c sample size, speci�c population and so on).
(d). Please check with all the assumptions for this two-way ANOVA analysis(model in part (b)) graphically and give speci�c comments to each of the assumptions.
(e). Do you think a transformation of the data is necessary? If yes, how? If no, why?
(f). Basing on the model suggested from part (e), please simplify the model by dropping the insigni�cant terms (you need to check with the assumptions whenever you have a new/di�erent model).
(g). Please draw conclusions of your two-way ANOVA analysis.
(h). Now, you have all the analysis of this problem. Please compile a brief statistic report to show the whole idea. You can follow the format of the example report. The report should be no more than 3 pages (including all the essential graphs).