Tension Test
The tension test is commonest of all tests. This is utilized to find many mechanical properties. A cylindrical machined specimen is rigidly held in two jaws of common testing machine. One join is part of a fixed cross-head, when other joins to the part of moving cross-head. The moving cross-heads moves slowly or gradually, applying a gradually applied load on the specimen.
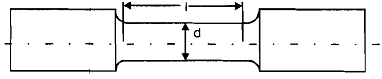
Diagram of Tension Test Specimen
The specimen is shown in diagram. The diameter of the specimen bears constant ratio along with the gauge length which is shown in diagram is as distance among two gauge points marked at the ends of uniform diameter length. In a standard specimen l/d = 5. The diameter d, and gauge length l, is measured before the specimen is placed in the machine. Like the axial force increases upon the specimen, its length raises, almost imperceptibly in the beginning. Although if loading continues the length begins to raises perceptibly and at certain point reduction in diameter becomes visible that followed by great reduction in diameter in the local region of the length. In this localized region the two parts of the specimen show to be separating like the machine continues to operate however the load upon the specimen begins to reduce. At last at some lesser load the specimen breaks, along with a sound, into two pieces. Though, the raise in length and decrease of load may not be seen in all the materials. Specimens of some materials demonstrate too much of extension and some illustrate too little. The reader must be conversant along with the elastic deformation, which is irrecoverable, which is recoverable and plastic deformation. Both types of deformations happen during the test. The appearance of visible reduces in the diameter in the short portion of length that called necking happen when the load on the specimen is highest. The machines of this type have arrangement or devices for the measurement of axial force, P and increase in length d. The values of force, P and extensions, d can be plotted on a graph. Various machines have x-y recorder attached to it and direct output of graph is acquired. The stress is denoted by s and calculated as P/A.
Whereas A is the original area of cross-section although the area of cross-section of specimen begins to change like the deformations goes plastic, this decreases is seen at and after the maximum load. The separation or fracture into two pieces can be seen to have happened on smaller diameter. Thus the stress all through the test, from beginning to end, D is presented by s = P/A. The strain is explained as the ratio of change in length at any A load P and original length l and presented by e, that is e = d/l at all loads. Because A and l are constants thus nature of graph among P and d load-extension or among s and e is stress-strain will be similar. Diagram shows a stress-strain diagram, typically for a material that has extended much before fracture happened. At first we merely observe that this diagram displays. In this diagram o is the starting point and oa is straight line. A long line oa, stress (s) is directly proportional to strain (e). Point b signifies the elastic limit, which means such if specimen is unloaded from any point in between o and b both inclusive the unloading curve will truly retrace the loading curve. Behaviour of specimen material from point b to c is not elastic. In many materials all 3 points of u, b and c may coincide. At c the specimen signifies deformation with no any increase in load or stress. In several materials notably low or mild carbon steel the load or stress may decrease perceptibly at c, followed through considerable deformation at the decreased constant stress. It will be shown in given section. Although, in most materials cd may be a small or extremely small region and then stress starts raisings as if the material has gained strength. Obviously the curve is more inclined toward e axis. It increase in stress from d to e is because of strain hardening. Note also again that ob is elastic deformation zone and beyond h the deformation is elastic and plastic it meaning that this is part recoverable and part irrecoverable. Like the deformation raises plastic deformation increases while elastic deformation keeps constant equal to that at b. If the specimen is unloaded from any certain point in the plastic deformation region the unloading curve will be parallel to elastic deformation curve like shown in diagram.
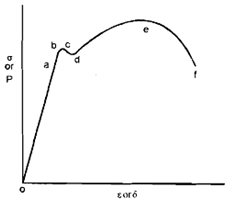
A typical σ-ε diagram
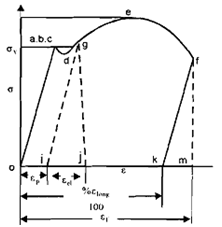
σ-ε diagram For Ductile Material
Percent Elongation From any point g the unloading will be along with gi whereas gi is parallel to oa. oi is the strain which keeps in the specimen or the specimen is permanently elongated by I ep. The total strain at g while the specimen is loaded is as oj = ep + eel, whereas eel is recoverable part. At fracture, that is at point f if one is capable to control and unload the specimen just before fracture, the unloaded will follow f k. The strain ok is an significant property since deformation is defined like percent elongation. Hence, ok = % elongation/100. Percent elongation is significant property and is often measured by placing two broken pieces together and measuring the distance among the gauge points. You can simply see that after the fracture has happened, the specimen is no more under load, thus elastic deformation which is equal to kilometer (km) is completely recovered. But, in a so-called ductile material kilometer (km) << om. If the distance in between gauge points measured on two broken halves placed together is If, then:
% elongation = ((If - l)/l) *100
The gauge length has pronounced effect on % elongation. Because the major amount of deformation happens locally, that is over extremely small length smaller gauge length will result in higher % elongation. After l/d > 5 the % elongation becomes independent of gauge length. % elongation is an indication of extremely important property of the material named as ductility. The ductility is defined as the property by virtue of which a material can be drawn into wires which means length can be increased and diameter can be reduced with no fracture. But, a ductile material deforms plastically before it fails. The property opposite to ductility is named as brittleness. A brittle material doesn't show enough plastic deformation. Brittle materials are weak under tensile dress, while they are stronger than most ductile materials in compression.
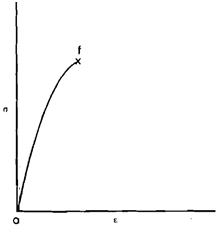
σ-ε diagram for a Brittle Material
A typical diagram for a brittle material is shown in diagram. The definitions as too much and too small % elongation fail to provide numerical indication. Thus engineers regard all those materials as brittle, which show a % elongation less than 5% other are regarded like ductile. Most steels in C or carbon and medium carbon (C) range are ductile by this definition. A typical brittle material is Cast iron. Concrete is another illustration of a brittle material. The failures in engineering structures and machine elements usually take place because of tensile stress and hence brittle materials are not utilized for making such elements. Such components like beds of machines and foundations can be made in cast iron. If tensile stress carrying members have to be made in c.1 after that they have to be made heavy for making stress very low.