Vector diagrams of phase relationships:
The circular renditions of sine waves that are shown in the 4 drawings of Figure given below, are well suited to showing phase relationships.
If the sine wave X is leading a sine wave Y by some number of degrees, then 2 waves can be drawn as vectors, with the vector X being that number of degrees counter clockwise from vector Y. If wave X lags Y by some degrees, then X will be clockwise direction from Y by that amount.
If the 2 waves are in phase, their vectors overlap. If they are in phase opposition, they point in opposite directions.
The Figure given below show 4 phase relationships between waves X and Y. At A, X is in the phase with Y. At B, X leads Y by 90°. At C, X and Y are 180°opposite in phase; at D, X lags Y by 90 degrees. In all the cases, you can think of the vectors rotating counterclockwise at rate of f revolutions per second, if their frequency is f Hz.
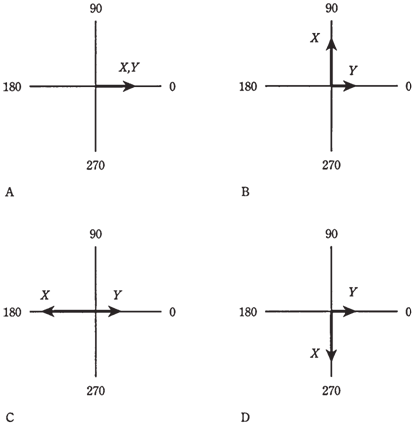
Figure Vector representation of phase. At point A, waves X and Y are in phase; at point B, X leads Y by 90 degrees; at C, X and Y are 180 degrees out of phase; at D, X lags Y by 90 degrees.