Pressure Enthalpy Diagram:
The refrigeration industry did not always contain the analysis tools which are available today. For several decades, the manufacturers & technicians relied on the graphical & tabulated values of refrigerant properties & expected equipment performance. Their one favourite tool was the pressure-enthalpy diagram that defines the thermodynamic properties for the refrigerant in use & the performance of the apparatus.
Pressure-Enthalpy Diagram along the Various Components of the Vapour Compression System
This chart illustrates the pressure expressed in bar beside the vertical axis. The energy content or enthalpy of the refrigerant is illustrated beside the horizontal axis in kJ/kg. The above pressure-enthalpy chart is distinctive of the refrigerant R22, a general refrigerant in small refrigeration systems.
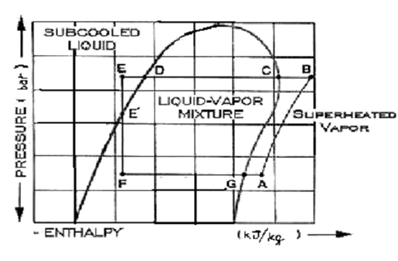
A quicker analysis of the chart illustrate that there are distinct regions separated through three "boundary lines". On the left the region is sub cooled liquid. It is the refrigerant liquid on a temperature lower than the corresponding boiling point for the pressure noted down.
The region inside the "dome" is a liquid-vapour mixture. If the liquid is at the boiling point, however just hasn't started to boil, this is defined as saturated liquid. Adding up any heat to this liquid shall vaporize a portion of it. Adding up more of heat to the liquid-vapour mixture eventually evaporates all liquid. At some exact point (G), the vapor is wholly saturated. Adding up any more heat to the vapour shall cause it to go up in temperature further; it is referred to as superheated vapour.
This is a common tendency to believe that a superheated vapour is "hot". It is not always the case. Superheated vapours might be cold. By the term superheated, we just mean that they are above the correspondent saturated vapour point. Likewise, sub cooled liquid can be warm in general. It only means that the liquid is cooler than the saturation line at that pressure. Now we present a detailed study of the pressure-enthalpy diagram.
We refer the refrigerant to be initially at pt A. To attain this point after leaving the evaporator at G, the refrigerant is heated slightly & crosses the compressor suction valve to pt A. The compressor raises the refrigerant's pressure to a point at that it may push the discharge valve open and pass into the condenser. The refrigerant vapour leaves the compressor at pt B, desuperheats to pt C, and then start to condense. After the vapour is fully condensed at point D, this is sub cooled a bit further (E), at which time it is yet at a much higher pressure in comparison of the evaporator.
By controlling the flow to the evaporator & throttling to the pressure of the evaporator is the job done through the expansion device, a capillary tube or a throttling valve in little refrigeration systems. This pressure reduction step vaporizes a part of the liquid that cools (called flash gas) the left over liquid going to point F. The "average" mixture of vapour & liquid crossing the valve doesn't modify in energy content. It merely separates into liquid & vapour at the decrease temperature & pressure according to its accurate thermodynamic properties. At point F the liquid is then ready to pick up heat in the evaporator and built vapour at point G where the cycle repeats itself.