Frequency spectrum:
The oscilloscope shows a graph of magnitude vs time. Because time is on the horizontal axis, the oscilloscope is a time-domain instrument.
Sometimes you want to see magnitude as the function of frequency, rather than as a function of time. This can be done with the spectrum analyzer. It is a frequency domain instrument having a cathode-ray display which is similar to an oscilloscope. The horizontal axis of it shows frequency, from some adjustable minimum to some adjustable maximum.
An alternating current sine wave, as displayed on a spectrum analyzer, appears as a single pip, shown in the figure given below. This means that all of the energy in wave is concentrated at 1 single frequency.
Many alternating current waves contain harmonic energy along with the fundamental frequency. A harmonic frequency is the whole number multiple of the fundamental frequency. For instance, if 60 Hz is fundamental, then harmonics can exist at 120 Hz, 180 Hz, 240 Hz, and so on. The second harmonicis the 120-Hz wave; the 180-Hz wave is third harmonic.
In general, if a wave has a frequency equal to n times the fundamental, then that wave is the nth harmonic. In the illustration of Figure given below, a wave is shown along with several harmonics, as it would look on display screen of the spectrum analyzer.
The frequency spectra of square waves and the sawtooth waves have harmonic energy in addition to the fundamental. The wave shape depends on amount of energy in the harmonics, and the way in which this energy can be distributed among the harmonic frequencies. A detailed discussion of the relationships is sophisticated.
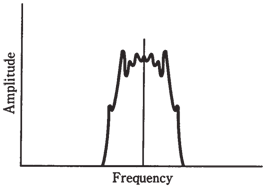
Irregular waves can have practically imaginable frequency distribution. An instance is shown in the Figure. This is a display of a voice modulated radio signal. The energy is concentrated at the center of pattern, at frequency shown by vertical line. But there is plenty of energy splattered around the carrier frequency. On an oscilloscope, this signal would look like a sine wave which is fuzzy, indicating that it is alternating current, although it contains a potpourri of minor components.

Figure-- At point A, pure 60-Hz sine wave on spectrum analyzer. At point B, 60-Hz wave containing harmonics.

Figure: Modulated radio signal on spectrum analyzer