 Charts when the Mean and the Standard Deviation are not known
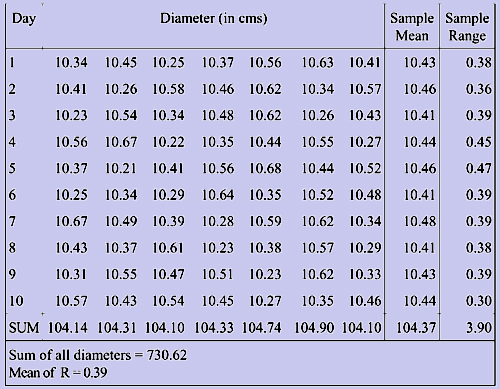
We consider the data corresponding to the example of Piston India Limited. Since we do not know population mean and the standard deviation, we employ the sample mean as a substitute. But for this data we have ten sample means and we do not know which one truly reflects the process mean. Therefore under these circumstances utilizing all the available data will be the best alternative. The calculation of mean from the sample means (this is referred to as grand mean and is denoted by  ), the calculation of the range and its mean are shown in the table 1.
Figure 8
| The grand mean, that is |
 , , |
is calculated by employing either |
 |
|
|
|
Both gives us the same answer and it can be seen that the second formula is derived from the first one. Here 'n' denotes the number of samples that are randomly selected on a day and k denotes the number of days we sample the pistons.
Table 1
The value of the grand mean in our problem by the first formula is given by
 |
= 10.437 |
and by the second version it is
 |
= |
10.437. |
As mentioned both the values are equal. This value of is utilized in drawing the center line in the chart. Now we look at how we calculate the standard deviation.
As we have employed the sample mean as a substitute for population mean, do we substitute the sample standard deviation for the population standard deviation? No. Since the control charts are usually plotted on the factory floor and since it is easy for the personnel to calculate sample range as compared to the sample standard deviation, it became a norm to employ the mean of the sample range in the calculation of the standard deviation. However, the relationship between the process standard deviation and the mean of sample range is given by a factor denoted by "d2 ". This factor depends on the size of the sample "n". The value of d2 can be found from the tables. For computing the values of the upper and the lower limits we employ the following formulae.
Further these limits can be expressed as 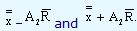 A2 denoting
  . It is possible to look for these values directly from the tables.
From the tables, the value of d2 is equal to 2.704 for a sample size of 7. In our example the values of the lower and the upper control limits are given by
| LCL |
= 10.437 - |
 |
= 10.27 |
| UCL |
= 10.437 + |
 |
= 10.60 |
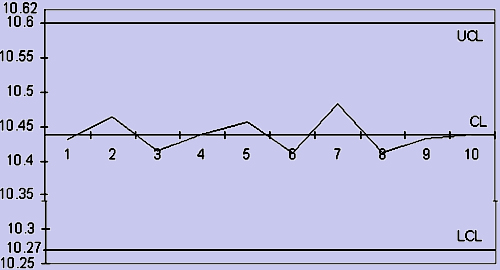
Using these values we plot the center and the limit lines. Nevertheless, we employ values to get the chart and determine whether the process is 'in-control' or 'out-of-control'. In our problem the chart denotes that the process is in-control and there is enough scope for us to tighten the control limits.