REVEALED PREFERENCE APPROACH
The downward slope of the demand curve was justified on the basis of utility derived by the consumer. But specification of consumer tastes in form of indifference curves is regarded as an unreasonable procedure. Above all utility whether cardinal or ordinal is non-measurable. This led to the development of an alternative approach that asks the consumer to reveal the nature of his preferences by showing which goods he prefers in different price - income situations. Therefore, this approach is known as revealed preference theory. It observes consumer behaviour when they make purchases, rather than suggests the idea that they operate with complete scale of preferences set out in form of indifference curves. The theory postulates that the choice of the consumer for a particular good or bundle of goods 'reveals his preference' for that good or bundle.
As with all economic theories, the revealed preference theory is based on certain assumptions as stated below.
1. The consumer has a given amount of income to spend on alternative combinations of goods during the reference period.
2. The consumer will choose that combination of goods which he ranks highest, the one which he prefers. So in one set of market condition, he will make one choice and in other situations, he will make different choices.
3. The consumer behaves rationally by making consistent choices so as to maximise his satisfaction. If A is above B, then B cannot also be above A. This is also referred to as two term consistency.
4. Consistent ordering also requires transitivity. Suppose A is preferred to B and B is preferred to C, then the consumer also prefers A to C.
Suppose there are two goods X and Y and the price of good Y and income is constant. Fig. 3.13 shows the preferences of the consumer. Initially, the consumer chooses point A on the budget line MX. Point A is thus 'revealed' as preferred to all other points on MX or within triangle OMX. We cannot say where point A will exactly lie on MX. It will lie closer to X - axis if the consumer prefers X relatively to good Y. Let us suppose now that the price of good X falls that pivots the budget line to position MX1. With a fall in price of X, the price of good Y and money income remaining constant, the consumer will now buy OX1 amount of X. It should be noted that the consumption of good X increases with a decrease in price of X.
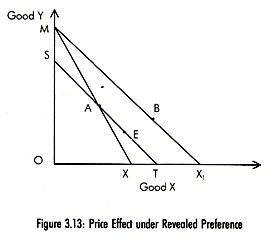
To derive the substitution effect of a price change, consumers' income is reduced by the amount required to leave him neither better nor worse off than he was at A that is his purchasing power is held constant. He is now on ST which is drawn through A and parallel to MX1. At the new prices, the money income is reduced by the amount that the consumer has sufficient income to buy atleast the original basket of goods. Hicks called this as the cost difference method. Let us denote the price A-prices and quantities by P0 and Q0 respectively, and B-prices and quantities by P1 and Q1 respectively. The A-situation can be denoted by P0Q0 where A quantities are bought at the A-prices. Similarly, the B situation can be denoted by P1Q1, where the Bquantities are bought at B-prices. If the consumers income is reduced so that he can if he wishes, just buy the A-quantities at B-prices, we can denote this position by P1Q0. The cost difference variation in income is given as:
P1Q1 - P1Q0
It is the difference in cost between the A-quantities and the B-quantities, both at the B-prices. This calculation can be easily made in any empirical work.
Now we can proceed to separate the price effect into two parts. The consumer cannot reach B, even though he is able to buy at the B-prices. He, therefore, moves from A, not to B, but to E. Indifference curve analysis easily identified the tangential point as the new equilibrium point to separate the income effect and substitution effect. The question is where will the consumer lie exactly on the line ST since choice will reveal preference? There are three possibilities:
(a) To the left of A on SA: Point E cannot lie to the left of point A since the choice would be inconsistent as in A-situation the consumer had already chosen A with A-prices. With a reduction in income, the triangle MSA is no longer a possible equilibrium area for him. He is not rich enough to move into any part of triangle due to reduction of his income by the cost difference.
(b) Coincide with A: This possibility is also ruled out as the third assumption is violated. It would mean that there is no substitution effect. The whole of move from A to B would be an income effect. There would be no income effect and substitution effect if A and E coincide because both are at the same point and represent the same combination of goods.
(c) To the right of A on AT: The point E must lie on AT as the consumer will be better off than at A which lies on the original budget line MX. The movement from A to E is the substitution effect, as in case of selection of A there would have been zero substitution effect. The whole of movement from E to B is the income effect since E lies on ST. But we cannot say how much of the move from A to B represents substitution effect and income effect.