MRI (magnetic resonance imaging) scanners allow doctors to now obtain complete body images for medical diagnosis purposes. The system produces scans which represent slices through the body highlighting soft tissue components. A full MRI investigation of a patient produces hundreds of sequential slices.
To diagnose problems these scans are typically checked manually. This is a time consuming procedure as the doctor may need to look for variations over a large number of slices.
The challenge is to write a program to automate the diagnosis process.
Consider the human aorta. Failure of this major artery is a fatal condition in many patients. The artery may be damaged in various ways. Blockage due to deposits of fatty residue lead to restricted blood flow to the lower body, Expansion (aneurism) due weakness of the artery wall caused by high blood pressure can cause catastrophic failure and internal bleeding. From the MRI scans it can be seen that an indication of the state of the artery can be determined based on the area of active blood flow (the brightest area of the scan).
1.'Reading'the'MRI'data'and'configuration'values'(mri1.m)'
MRI slices can be stored in files (image001.png, image002.png, and so on). Each file is a regular PNG image file containing a 200 x 200 matrix of values covering the area of the scan that can be read using the MATLAB imread function. Each value (ranging between 0-255) represents the brightness at the corresponding point on the scan (just like a regular photo).
Your program should ask the user for the threshold to use to estimate active blood flow (around 220 is a good value). If the user enters a value outside of the range 0-255 then your program should continue to ask for a valid value.
Your program should read and process all of the 10 image files you are supplied. It should report the number of pixels that are above the threshold in each image, like this for a 220 threshold:
scan 1 has 1539 pixels above the threshold
scan 2 has 1412 pixels above the threshold
...
2.'Smoothing'the'MRI'data'(mri2.m)'
Like any measurement process, the MRI scan contains noise, which makes automated analysis difficult. For instance, the images contain smaller patches of brightness that are not part of the major blood flow area. A simple way of reducing the noise is to replace each value with the average of the point and the 8 neighbours surrounding the point, thereby smoothing out the data.
Your program should calculate new matrices where each point consists of the average of the surrounding 8 points and itself.
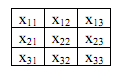
The new value of x22 is the average of x11...x33. For simplicity, you do not need to calculate the average for the pixels on the edge. For each of these smoothed scans, report the percentage of pixels above the threshold as above.
Your program should also calculate the average area above the threshold over all 10 images and then report images that are either 10% over (aneurism) or 20% under (blockage) the average:
slice 5 has a potential blockage
slice 6 has a potential blockage
slice 7 has a potential aneurism
...
3. 'Visualizing'the'aorta'(mri3.m)'
You should visualize the smoothed versus original images of the aorta as a colour map using the MATLAB imagesc function. Then use the getframe and movie2avi functions to create a movie of the 10 smoothed images in sequence to see how the aorta changes shape as the slices move down the body.
4.'Extension:'Smarter'aorta'measurement'(mri4.m)'
Implement your own strategy that improves on how the active blood region is identified and its area measured, and how these measurements are compared between images. The active blood flow area is defined by a large coherent group of bright values but we're currently measuring all bright pixels. There may be other individual bright values or small groups of bright values that represent scanning variations not active blood flow area that we should ignore (perhaps with the help of the specialist).