Linear regression model, Basic Statistics

Assignment Help:

Q. Explain Linear Regression model?

Ans.

Linear correlation measures the strength of a linear relationship, but not the exact numerical relationship. Linear regression, on the other hand, helps us predict outcomes given a data set. For example, how can we predict the distance needed by a car to stop based on its speed?

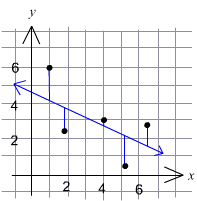
Given the value of an independent variable (x-axis), we want to be able to predict the value of the dependent variable (y-axis).

In order to make these predictions, we use the linear-regression line or the least-squares line with the scatter plot of data.
1397_Linear Regression model.gif


The linear-regression line fit minimizes the vertical distances for a data set. (See the vertical blue lines in the diagram).

In fact, the closer the correlation coefficient, r, is to +1 or 1, the better the linear-regression line fits the data. Recall that when r = +1 or 1 the data is said to have a perfect correlation (all points of the data set will lie on a line). The linear-regression line can be found using a graphing calculator. There are more sophisticated methods of finding the linear-regression line that are taught in more advanced statistics courses.

Statisticians look for the equation of the linear-regression line because it expresses the relationship between the two variables x and y. Regression analysis calculates an equation that provides values of y for given values of x. Usually the exact value of y is not predictable, but regression analysis will allow us to make reasonably close predictions.


Related Discussions:- Linear regression model

Assignment, i want you to make my buisiness statistics assignment

i want you to make my buisiness statistics assignment

INTRODUCTION TO STASTICS, Let a and b be constants and le yi=axi+b for i=1,...

Let a and b be constants and le yi=axi+b for i=1,2,...n. W HAT IS THE RELATION SHIP BETWEEN mean and variancees of X and Y ?

Probability, the probability that you win a game is 0.3. if you play the ga...

the probability that you win a game is 0.3. if you play the game 20 times. what is the probability that you will win at least 8 times?

Demonstrate the potential risk from financing in eurodollars, You have the ...

You have the following information about rates in London for Eurocurrency loans of one-year duration, the exchange rate between the USD and euros, the currency in which you want fi

Biostatics, A national study found that treating people appropriately for h...

A national study found that treating people appropriately for high blood pressure reduced their overall mortality by 20%. Treating people adequately for hypertension has been diffi

Predictive Sales Report, A retail store has recently hired you as a consult...

A retail store has recently hired you as a consultant to advise on economic conditions. One important indicator that the retail store is concerned about is the unemployment rate.

DIFFARENCE , Differentiate between Historigrams and Histogram

Differentiate between Historigrams and Histogram

Analyzing pre-collected data using spss, This is not a statistics course, b...

This is not a statistics course, but you need to conduct some analyses to help solidify your knowledge and understanding about statistical data analysis.  Now you will use the ' pr

Write Your Message!

Captcha
Free Assignment Quote

Assured A++ Grade

Get guaranteed satisfaction & time on delivery in every assignment order you paid with us! We ensure premium quality solution document along with free turntin report!

All rights reserved! Copyrights ©2019-2020 ExpertsMind IT Educational Pvt Ltd