Kruskals algorithm, Data Structure & Algorithms

Assignment Help:

Krushkal's algorithm uses the concept of forest of trees. At first the forest contains n single node trees (and no edges). At each of the step, we add on one (the cheapest one) edge so that it links two trees together. If it makes a cycle, simply it would mean that it links two nodes that were connected already. So, we reject it.

The steps in Kruskal's Algorithm are as:

1.   The forest is constructed through the graph G - along each node as a separate tree in the forest.

2.   The edges are placed within a priority queue.

3.   Do till we have added n-1 edges to the graph,

  I.   Extract the lowest cost edge from the queue.

 II.   If it makes a cycle, then a link already exists among the concerned nodes. So reject it.

 III.  Otherwise add it to the forest. Adding it to the forest will join two trees together.

The forest of trees is a division of the original set of nodes. At first all the trees have exactly one node in them. As the algorithm progresses, we make a union of two of the trees (sub-sets), until the partition has only one sub-set containing all the nodes eventually.

Let us see the sequence of operations to determine the Minimum Cost Spanning Tree(MST) in a graph via Kruskal's algorithm. Suppose the graph of graph shown in figure  and below figure  illustrates the construction of MST of graph of Figure
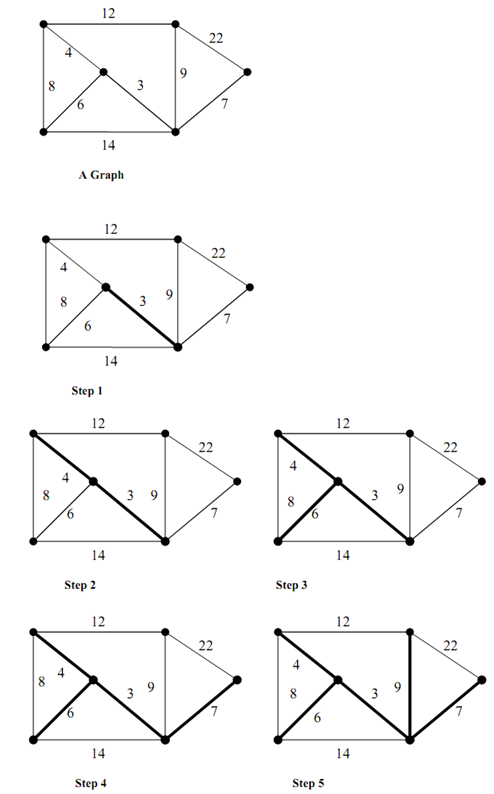
1339_Kruskals Algorithm.png

Figure: A Graph

Figure: Construction of Minimum Cost Spanning Tree for the Graph by application of Kruskal's algorithm

The following are several steps in the construction of MST for the graph of Figure via Kruskal's algorithm.

Step 1 :  The lowest cost edge is chosen from the graph that is not in MST (initially MST is empty). The cheapest edge is 3 that is added to the MST (illustrated in bold edges)

Step 2: The next cheap edge which is not in MST is added (edge with cost 4).

Step 3 : The next lowest cost edge that is not in MST is added (edge with cost 6).

 Step 4 : The next lowest cost edge that is not in MST is added (edge with cost 7).

Step 5 : The next lowest cost edge that is not in MST is 8 but form a cycle. Hence, it is discarded. The next lowest cost edge 9 is added. Now the MST has all the vertices of the graph. This results in the MST of the original graph.


Related Discussions:- Kruskals algorithm

Whether the infix expression has balanced parenthesis or not, Using stacks,...

Using stacks, write an algorithm to determine whether the infix expression has balanced parenthesis or not Algorithm parseparens This algorithm reads a source program and

Illustrate trivariate colour models, Illustrate Trivariate Colour Models ...

Illustrate Trivariate Colour Models Conventional colour models based on the tristimulus theory all contain three variables and so are called trivariate models. Let us now consi

Sparse metrics, Q. Define the sparse metrics and also explain the represent...

Q. Define the sparse metrics and also explain the representation of a 4X4 matrix using linked list.         Ans: A matrix in which number of zero entries is quite h

Context sensitive f1 help on a field, In what ways we can get the context s...

In what ways we can get the context sensitive F1 help on a field?' Data element documentation. Data element additional text in screen painter. Using the process on help r

Explain about the structured types - built-in types, Explain about the Stru...

Explain about the Structured types - Built-In Types Values of the carrier set are not atomic, consisting rather than several atomic values arranged in some way. Common illu

Stack and array, how to implement multiple stack using single dimension arr...

how to implement multiple stack using single dimension array in c

Column major representation, Column Major Representation In memory th...

Column Major Representation In memory the second method of representing two-dimensional array is the column major representation. Under this illustration, the first column of

Advantages of dry running a flowchart, Advantages of dry running a flowchar...

Advantages of dry running a flowchart When dry running a flowchart it's advisable to draw up a trace table illustrating how variables change their values at every stage in the

Write Your Message!

Captcha
Free Assignment Quote

Assured A++ Grade

Get guaranteed satisfaction & time on delivery in every assignment order you paid with us! We ensure premium quality solution document along with free turntin report!

All rights reserved! Copyrights ©2019-2020 ExpertsMind IT Educational Pvt Ltd