Introduction to vectors, scripts, and functions, MATLAB Programming

Assignment Help:

In this lab, we study the three concepts. Vector is used to store more than one value into single variable. It is similar to array (other programming language). Script is a collection of statement which is stored into single file name. Function is used to solve the equation and return the result value. It has parameters also.

Sample of Vector:

» x=[-2:5]

x =    -2    -1     0     1     2     3     4     5

Sample of Script:

Impact_v1.m contains,

M=input('Enter the value of m, Mass of the Airplane : ');

V=input('Enter the value of v, Velocity of the Airplane : ');

D=input('Enter the value of Displacement, Displacement of the Airplane : ');

F=(0.5*M*V^2)/D;

disp('The value of the force is printed below : ');

F

How to run the Script?

            » run impact_v1

Sample functions:

function f = ImpactForce(m,v,d)

f = 0.5*m*v^2/d ;

We have learned how to work with vectors and plots. As a result of this lab we computed the impact force for initial velocities from 10m/s to 50m/s as shown in Figure 1. The computations are performed in the ImpactForceVec.m function and the script to set up the calculation is called Impact_v3.m.

297_Introduction to Vectors, Scripts, and Functions.png

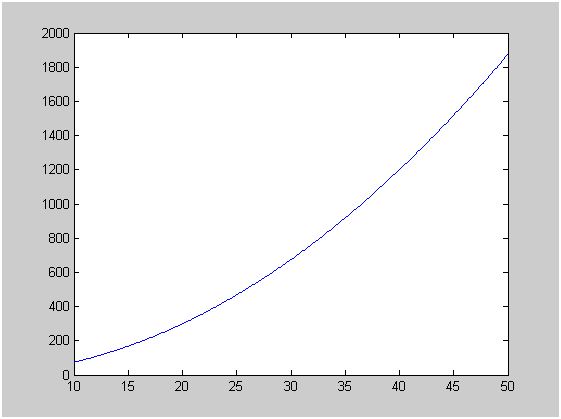
Figure 1: The figure shows the impact force on the building for initial speeds ranging from 10m/s to 50m/s. The mass of the aircraft is taken to be 10,000kg, and a stopping distance of 15m is used.


Related Discussions:- Introduction to vectors, scripts, and functions

Looping statements, Looping Statements: Consider the problem of comput...

Looping Statements: Consider the problem of computing the area of a circle with radius of 0.3 centimeters-a MATLAB program certainly is not required to do that; you would use

Calculate the mean-mode and median, You are given data similar to the examp...

You are given data similar to the examples and sample problems in the statistics topic. Write MATLAB program to do the following: 1. Plot histogram, relative frequency histogram

Solve the system of linear equations - matlab, Problem 1.  Use Matlab to so...

Problem 1.  Use Matlab to solve the following system of linear equations: 2x + y + 3z = 1 2x + 6y + 8z = 3 6x + 8y + 18z = 5 Capture Matlab code and the result in a text fi

Output statements, Output Statements: disp and fprintf: The Output sta...

Output Statements: disp and fprintf: The Output statements display strings and the answers of expressions and can permit for formatting or customizing how they are exhibited.

Image and video compression, Read in any non jpeg image (any image will do)...

Read in any non jpeg image (any image will do) . Save it as a jpeg at quality levels (70, 60,50,40, 30) Get the MSE for each quality level as compared to the orignal file Get the

Equations of motion of shaft-rotor system, Consider the shaft-rotor system ...

Consider the shaft-rotor system shown in Figure. Write down the equations of motion. Taking  I= 1 kgm 2 and k=10 kNm/rad, for two special cases (α =0.5 and α = 1000) find as many

Algebra, what equation equals 36

what equation equals 36

2D steady state heat conduction, How do I compute and plot a temperature pr...

How do I compute and plot a temperature profile along the x axis from -6 to 6 given the equation for steady state heat conduction and boundary conditions

Write Your Message!

Captcha
Free Assignment Quote

Assured A++ Grade

Get guaranteed satisfaction & time on delivery in every assignment order you paid with us! We ensure premium quality solution document along with free turntin report!

All rights reserved! Copyrights ©2019-2020 ExpertsMind IT Educational Pvt Ltd