Step 1: Stock Data: Choose four stocks, 2from the Dow Jones Industrial Average (DJIA 30) and 2other stocks of your choice.Download, import, or copy and paste the monthly price information. To find the information on the website, click on "Dow" from the banner across the top, and click "components" on the next page (alternatively I have posted a list in Assignments on Scholar). Now choose a stock by clicking on the blue ticker symbol (e.g., AA, HD, WMT, etc.). Once you are on the page for the individual stock selected, click on "historical prices," and set the appropriate date range. Once the date range is set, click "Get Prices." Now that you have the data, scroll to the bottom of the page and click "download to spreadsheet." You should choose to "save" the data and pick a location on your computer. (A suggestion for clarity is to create one file with 5 worksheets (one for each stock and one for the index later) using the ticker symbol or complete name of the stock). This will download the data into a CSV (comma delimited) file which you can save as an Excel file. You will now repeat these steps for the other 3 stocks.
When you download the data, it may be listed vertically in reverse chronological order. In other words, the most recent date is at the top and descends to the last date at the bottom. You will re-sort this data later in the assignment. Please select stocks from different industries, in other words do not choose AXP and JPM because both of these are financial stocks. Also, don't simply pick the first 2 stocks listed on the Yahoo Dow page, and don't knowingly pick the same stocks chosen by any other group.Make sure that the stock has price data back to February 1998 for at least 3 of your stocks and make sure that you have data back to February 2003for all 4 of your stocks.
Step 2) Stock Data: Once you have the stock data files, you will need to combine the data into the worksheet in my template document titled "Monthly Data". You ONLY need the date and the "adjusted close" price for each stock. For the first stock, copy and paste the "Date" column into column A of your sheet and the "adj close" column into column B of your sheet. Do the same for the other stocks, putting"date" and "adj close" columns into columns C and D, and E and F, and so forth. (You may also use any other reasonable format.) The adjusted closing price takes the closing price and adjusts for stock splits and assumes reinvestment of dividends in the firm's shares.
Step 3) Import, or copy and paste the monthly information for the S&P 500 into your "Monthly Data" worksheet in the template. To find the information on the website, on the left edge click on the appropriate index, on the next page click "historical prices," and set the appropriate date range. Repeat Step 2 for the index data and paste the data into the next two available columns.
Verify that you have the same date ranges for each stock and the index, and then delete the extra "date" columns.In your "Monthly Data" sheet, you should now have a single date column and monthly price data for 4 stocks, and the S&P 500 index. As noted above, you may have one stock whose returns only go back to February 2003.
Stage: Manipulating the Data
Step 1) Sorting:Arrange the data using the sort feature so that the dates are ascending (oldest on top to newest on bottom). Be sure to select all columns of data before sorting or all you will do is "flip" the dates.
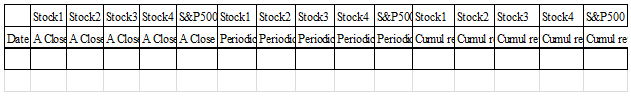
Step 2) Create new columns: Using the example below, create the additional columns so that your "Monthly Data" sheet has the following columns: (the additional columns will be filled by following the directions below)