Example on indifference curves and budget lines, Microeconomics

Assignment Help:

Since 1990, real income has increased rapidly, yet the average number of children per family has decline." Three possible explanations for this process are given below. Explain each of them using indifference curves and budget lines showing the tradeoffs between the composite commodity (CC) and number of children. Also give a verbal explanation.

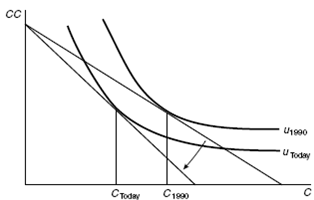
 a. Children are an inferior good; parents demand, as income rises fewer children.

ANSWER:  As given below, as income rises, the budget line gear up and the new optimal choice happens at the point of tangency between the highest indifference curve and new budget line. Since children are an inferior good, the quantity of children after the income increase will exceed the quantity of children before the income increase.

b. Children are basic goods but they have become more expensive to raise.

ANSWER: As explained below, an increase in the cost of raising children can pivot the budget line so that fewer children will be afforded if the entire income is used on children. The substitution effect may cause fewer children to be raised. The income effect can work in the same direction - a lower real income because of the increase of the cost of raising children will cause fewer children to be raised.

784_Example on indifference curves and budget lines.png

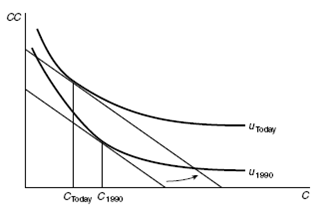
c. Children are not more expensive; the tastes of parents have modified, such that children are less preferred now than they were in 1990 ".

ANSWER: As explained below, a modification in tastes will modify the position and shape of the indifference curves - indifference curve will become flatter for each level of C. Thus, for a given budget line, fewer children will be raised.

1527_Example on indifference curves and budget lines1.png


Related Discussions:- Example on indifference curves and budget lines

Oligopoly, characteristics and models of oligopoly by Sweezy,cournot and ed...

characteristics and models of oligopoly by Sweezy,cournot and edgework

Derivation of compensated demand curve, Derivation of compensated demand cu...

Derivation of compensated demand curve:  Hicksian compensated demand function for x 1 is given by x 1 =x 1 (p 1 , p 2 , U), where Hicksian compensated demand curve for a good

Consumer behaviour, do you think that dimnishing returns to a factor are co...

do you think that dimnishing returns to a factor are consistent with increasing returns to scale? explain with suitable diagram and reasoning.

Determinants of social demand for education - equity, Determinants of Socia...

Determinants of Social Demand for Education - Equity Perfect equality is not observed in any society. Hierarchy in status, standards of living, capacities for effective demand

Describe the law of supply, Supply of a commodity is functionally related t...

Supply of a commodity is functionally related to its price. The law of supply rated to this function relationship between price of a commodity and its supply. In contrast to the in

Employment, Employment The calculations of human input in the producti...

Employment The calculations of human input in the production procedure. In the United States, there are two major measures of employment, as determined by the Bureau of Labor

Write Your Message!

Captcha
Free Assignment Quote

Assured A++ Grade

Get guaranteed satisfaction & time on delivery in every assignment order you paid with us! We ensure premium quality solution document along with free turntin report!

All rights reserved! Copyrights ©2019-2020 ExpertsMind IT Educational Pvt Ltd