Example of inference, Basic Statistics

Assignment Help:

Q. Example of inference?

Ans.

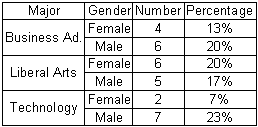
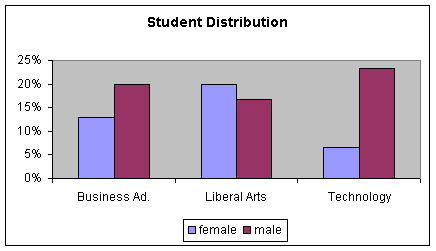
Thirty students from a college were surveyed and classified according to two variables: (1) gender (M/F) and (2) major (liberal arts, business administration, technology). The results of the survey are shown in this chart and histogram.
2406_Example of inference.gif

2035_Example of inference1.gif

What inferences might you make based on this data?
What precautions should you have about making these inferences?

Solution:

1. Inference:

You might make the following inferences from the sample data:

A. The most drastic difference in the above histogram seems to be in the percentage of females majoring in technology compared to the percentage of males in technology. About 23% of the people sampled were male and in technology whereas only 7% of the sample population was female and in technology. From this data, you might deduce that there are over 3 times as many male technology majors as there are female technology majors in the college.

B. Another inference you might make, based on the comparison of gender is that liberal arts has a smaller gender divide than both other major areas because there seem to be an almost equal number of males and females who are majoring in liberal arts.

C. Look at the total number of people in the sample majoring in the different subject areas. 33% of the sample are majoring in business administration, 37% are in liberal arts and 30% are in technology. You might infer that these percentages reflect the entire college student population too.

D. You might use this information to predict the choice of majors for freshmen based on their genders. It seems much more likely that a female freshman would choose to major in business administration or liberal arts than in technology.

E. Notice that the sample population was 40% female and 60% male. You might infer from this that the college has 60% male and 40% female students, too.

2. Precautions:

A. Is this sample a good representation of the school? How was the sample chosen? Were all the students in the library at one time, in the lobby of a building, in the student center? What time was the survey done? Was it early in the morning or late in the evening? Was there any effort to get a representative mix of years? Were all students in the sample in their senior year?

B. Is this sample (30 students) large enough to conclude anything accurately about the entire college population? The larger a sample population, the more accurately the sample data reflects the population data. This is often a serious concern among statisticians. How big is big enough.


Related Discussions:- Example of inference

Do a full regression analysis , #questioAssessment Part 2 (70%) You may un...

#questioAssessment Part 2 (70%) You may undertake the analysis of one of the following three case studies: (a) Crime (Minitab project file: CRIM

Compute the sample correlation matrix, 1 Compute SX; SXY ; and SY . > # Put...

1 Compute SX; SXY ; and SY . > # Put your R code here. 2 Compute the sample correlation matrix (q_p) between the X and Y variables. Test individual correlations for significance

Applied problems, A company determines that the profit (P) in Pula and the ...

A company determines that the profit (P) in Pula and the advertising expenditure (e) in Pula have a linear relationship. a) Find an equation of linear relationship

Help with homework, 1. Penny Pincher, Inc. had a contribution margin of $33...

1. Penny Pincher, Inc. had a contribution margin of $33,000 on sales of $50,000 and had fixed costs of $18,000. Calculate its break-even point in sales dollars. 2. Krueger Company

Why do organisations need a structure, Question 1: (a) The grouping of ...

Question 1: (a) The grouping of organisational activities (usually into ‘departments' or larger ‘divisions') will be done in different ways. Outline the criteria which can be u

Interpret predictability and behaviou, Shafts are cut to length by two mach...

Shafts are cut to length by two machines, A and B. Each machine cuts 50 percent of all shafts in approximately the same amount of time. Machine A's shafts are all good, but Machine

BALANCE SHEET , BALANCE SHEET A financial report that shows the resources,...

BALANCE SHEET A financial report that shows the resources, obligations, and stock of a business at a specified time frame in complying with usually recognized sales concepts (GAAP

The data analysis process and statistical techniques, I need to conduct an...

I need to conduct an analysis' on an alcohol and substance abuse study. the data set is too large to upload . The data set is the SPSS version that I need to work from. Here is the

Calculate bonferroni confidence intervals, The "recoverytime" files record ...

The "recoverytime" files record the time (in days) for male blue-collar workers to recover from a common wrist fracture. Each man was given a questionnaire to complete to determine

Population, Explain what is meant by population and sample

Explain what is meant by population and sample

Write Your Message!

Captcha
Free Assignment Quote

Assured A++ Grade

Get guaranteed satisfaction & time on delivery in every assignment order you paid with us! We ensure premium quality solution document along with free turntin report!

All rights reserved! Copyrights ©2019-2020 ExpertsMind IT Educational Pvt Ltd