Create a matlab script file, MATLAB Programming

Assignment Help:

Damped free vibrations can be modelled by considering a block of mass m that is attached to a spring and a dashpot as shown.

2474_Damped free vibrations.png

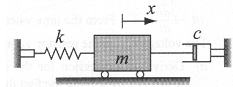
From Newton's second law of motion, the displacement x of the mass as a function of time can be determined by solving the differential equation:

2219_Damped free vibrations1.png

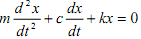
where k is the spring constant, and c is the damping coefficient of the dashpot. If the mass is displaced from its equilibrium position and then released, it will start oscillating back and forth. The nature of the oscillations depends on the size of the mass and the values of k and c.

(a) Create a MATLAB script file that calls for input of m, k, c, and xo. This file calls at least two functions i.e. function (b) that calculate x and v, and function (c) that animates the mass motion.

(b) Create a function M-file that calculates the displacement x and the velocity v of the mass, as function of time, t.

(c) Create another function M-file to create the animation of the mass motion.

(d) Demonstrate the program for two cases: 

(i) c = 3 N-s/m for 0 ≤ t ≤ 20s

(ii) c = 50 N-s/m for 0 ≤ t ≤ 10s

For the system shown in the figure m = 10kg, and k = 28 N/m. At time t = 0 the mass is  displaced to x = 0.18m, and then released from rest.

(e) Write a report describing your programs developed in (a), (b), and (c), and comment on your observation of the results from the two cases in (d).


Related Discussions:- Create a matlab script file

Matrix, if i have a 3x2 double.. how can i run a for loop for this matrix s...

if i have a 3x2 double.. how can i run a for loop for this matrix so tht it can subtracted values of he adjacent neighbors?

Find the distribution of data with matlab, how to make a histogram of data,...

how to make a histogram of data, example x=[5 6 3 2 5] and then find the distribution

Filter design, IIR filter using Bilinear trasformation

IIR filter using Bilinear trasformation

planar pantograph-based leg, The diagram shown on the next page represents...

The diagram shown on the next page represents a planar pantograph-based leg for a walking robot. This model utilizes only one DOF to generate the walking gait at the foot link 'n

#GUI, #create a matlab GUI for designing common emitter amplifier which pro...

#create a matlab GUI for designing common emitter amplifier which produces AC load lines based on the component values

CDMA, Code and decode a 32 bit long data for a specific user in CDMA if the...

Code and decode a 32 bit long data for a specific user in CDMA if there is only 1 user and no noise.

Example of referring elements, Example of Referring elements: the vect...

Example of Referring elements: the vector can also be extended. For illustration, the following generates a vector which has three elements. And then referring to the fourth e

Cascade refrigeration system, how to wrote the mat lab programme and analys...

how to wrote the mat lab programme and analysized for different refrigerant using in cascade refrigeration system

Pre- dicting and plotting., You will need to implement at least two Matlab...

You will need to implement at least two Matlab functions: HW3main.m and svmTrain.m. The implementation details are as follows: function [alpha] = svmTrain(X,T,kernel,C,sigma) %

Write Your Message!

Captcha
Free Assignment Quote

Assured A++ Grade

Get guaranteed satisfaction & time on delivery in every assignment order you paid with us! We ensure premium quality solution document along with free turntin report!

All rights reserved! Copyrights ©2019-2020 ExpertsMind IT Educational Pvt Ltd