1. Introduction:
Theory: Amplitude is defined as the magnitude of the change in the oscillating variable with each oscillation within an oscillating system. It is calculated as the maximum distance between the extreme points of a curve and the equilibrium value. Following figures shows the peak-to-peak amplitude.
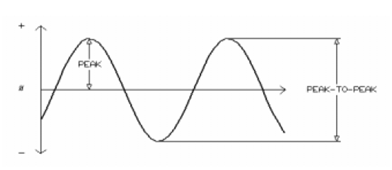
Peak-to-peak amplitude is the change between peak (highest amplitude value) and trough (lowest amplitude value, which can be negative). The peak value is defined as the amplitude measured between the horizontal axis and either of the peak values.
Peak value = (1/2) Peak-to-peak value
Material Required: Oscilloscope, Frequency generator, connecting wires, resistor, multimeter.
Description and Aim: To measure the amplitude of an AC waveform using an oscilloscope.
An AC waveform has to be generated from the frequency generator. This waveform is displayed at the oscilloscope and the no of vertical divisions covering the extremes of the waveform are cautiously measured. These extremes give the value of V(pk-pk).
2- Method:
Step 1) Turn on the Oscilloscope and use all the fundamental ports.
Step 2) Use terminal ports to connect generator to DC/AC waveforms circuit clock. Use a two port connector to connect generator source (GEN) to resistor R1.
Step 3) Turn on the generator. Set frequency to 60 Hz at oscilloscope. Adjust the Channel 1 vertical coupling to AC and Channel 1 attenuator to 0.1 V/div. Also set the horizontal time base control to 2ms/div.
Step 4) Connect channel 1 probe of oscilloscope across R1. Adjust generator amplitude to produce a sine wave with height equivalent to 6 divisions. The higher number of divisions ensures better accuracy in the measurement. Try to use the knobs in case there are some distortions coming on the oscilloscope to stabilize them. Peak to Peak voltage of displayed waveform (Vr1) is now 6 Vpk-pk
Step 5) Now disconnect X10 probe from the circuit. Turn on the multi-meter and set it for AC voltage measurement. To measure voltage, make sure that multi-meter is connected across R1 and then voltage is measured.
Step 6) Take the readings and then remove the circuit connections. Switch off the oscilloscope.
3 - Results:
Frequency of oscilloscope = 60 Hz
V(pk-pk) = 6 V
Peak voltage = Vpk = Vpk-pk / 2 = 6/2 = 3 V
V(rms) = Vpk * 0.707 = 2.121 V
V(avg)= Vpk * 0.637 = 1.911 V
4 - Discussion:
The major factors which affected our results are the waveform generated from the frequency generator. Secondly, the resistor should not be changed in between the experiments as it also decides the final voltage been displayed at the oscilloscope. Lastly, the waveform was enlarged to include maximum no of divisions on oscilloscope. This helps us to take accurate readings. The theoretical and measured results were found almost similar.