In large sized linear programming problems, the solution cannot be obtained by the graphical method and hence a more systematic method has to be developed to find the optimal solution. The 'Simplex Method' developed by George B. Dantzig is an efficient algorithm to solve such problems. The simplex method is an iterative procedure for moving from an extreme point with a low profit value to another with a higher profit value until the maximum value of the objective function is achieved.
An application of the simplex method is illustrated below with the problem solved by the graphical method.
Maximization
Example
Maximize Z: 70q1 + 40q2
subject to:
|
2q1
|
+ |
q2
|
<120 |
|
0.8q1
|
+ |
0q2
|
<40 |
|
3q1
|
+ |
2q2
|
<200 |
|
4q1
|
+ |
3q2
|
<360 |
|
q1
|
> |
0, q2
|
>0 |
The first step in applying the simplex method is to convert all inequalities into equations. This conversion could be accomplished by utilizing the concept of slack or unused resources. If we define:
| S1 |
= |
slack raw material-1 |
| S2 |
= |
slack raw material-2 |
| SL |
= |
slack labor |
| SC |
= |
slack foundry capacity |
Then the constraints will be:
| 2q1 |
+ |
q2 |
+S1 |
= 120 |
| 0.8q1 |
+ |
0q2 |
+S2 |
= 40 |
| 3q1 |
+ |
2q2 |
+SL |
= 200 |
| 4q1 |
+ |
3q2 |
+SC |
= 360 |
q1 > 0, q2 > 0, S1 > 0
S2 > 0, SL > 0, SC > 0
The profit contribution of slacks is taken as 0 so that the objective function is
70q1 + 40q2 + 0S1 + 0S2 + 0SL + 0SC
which is to be maximized. Let us call the original variables q1 and q2 as regular variables and the others as slack variables.
We must first form an initial solution to the constraints. This is obtained by assigning the value '0' to the regular variables q1 and q2, i.e., we shall start at the point 0 in the graph. The values of slack variables will now be:
S1 = 120
S2 = 40
SL = 200
SC = 360
The non-flow variables are called basic variables and the others are called non-basic variables (Basic: S1, S2, SL, SC; Non-basic: q1, q2).
We shall now construct the initial tableau and update it eventually. The explanation is given at the end of each table.
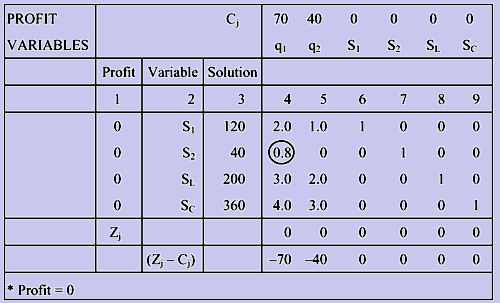
Explanation
-
Columns (4) to (9) represent all the variables that appear in the problem, that is, q1, q2, S1, S2, SL and SC.
-
First, fill in the second row with the variables.
-
Fill in the first row with the profit contribution of these variables. The profit contributions are the coefficients of the variables in the objective function.
-
Fill column (2) with the slack variables, S1, S2, SL, SC.
-
Fill column (1) with the profit contribution of variables that appear in column (2).
-
Fill column (3) with the solution values of the variables in column (2).
-
Column (4) is filled with coefficients of q1 in the constraints. Similarly, columns (5) to (9) are filled with the coefficients of q2, S1, S2, SL and SC respectively, in the constraints.
-
The value in the profit cell {column (3), last row} is obtained by multiplying the elements of column (1) with the elements of column (3), that is,
0 x 120 + 0 x 40 + 0 x 200 + 0 x 360 = 0
This implies that, for the initial solution q1 = 0, q2 = 0 (that is, no production), the profit realized is 0.
9. The cells in the last row under columns (4) to (9) are called (Zj - Cj) cells.
These values indicate the increase in the objective function per unit increase in the value of the variable currently at 0. In the initial tableau, this row is obtained by subtracting Cj from Zj where Zj is the summation of products of each value in columns (4) to (9) and the value in column (1). For instance, the Zj value for column (4) is 2 x 0 + 0.8 x 0 + 3 x 0 + 4 x 0 = 0. For column (5), Zj is 1 x 0 + 0 x 0 + 2 x 0 + 3 x 0 = 0.
Tableau 1 is now complete. At the end of each tableau, we should decide whether to update it to obtain a better solution, or to stop. This is done by the following steps:
Step 1: Is the solution indicated in the tableau optimal?
The answer to this question is obtained by looking at the (Zj - Cj) values in the last row. As mentioned above, these values indicate the profit that could be gained by increasing the production levels.
For example, the Zj - Cj value corresponding to variable q1 is -70. This indicates that, by not producing type A castings, the foundry has lost Rs.70 per unit and hence by increasing the production level of type A castings, the foundry can increase its profit at the rate of Rs.70 per unit increase in production. Similarly, the foundry can increase its profit by Rs.40 by increasing the production level of type B castings. Thus, as there is scope for improving the profit, we have not reached the optimal solution.
Thus, we can answer the initial question by looking at all the (Zj - Cj) values. If all these values are greater than or equal to zero, it implies that we have reached the optimal solution and hence we should stop. If one of the Zj - Cj values is negative, then we should go to the next step.
Step 2: Find the variable to 'enter solution'
This means identifying the product for which the production level has to be increased. We have seen that it is optimal to increase the production level of q1. The rule is:
Identify the least negative Zj - Cj value. Thus the corresponding (non-basic) variables will increase in value. In this case, q1 has been selected to be a basic variable.
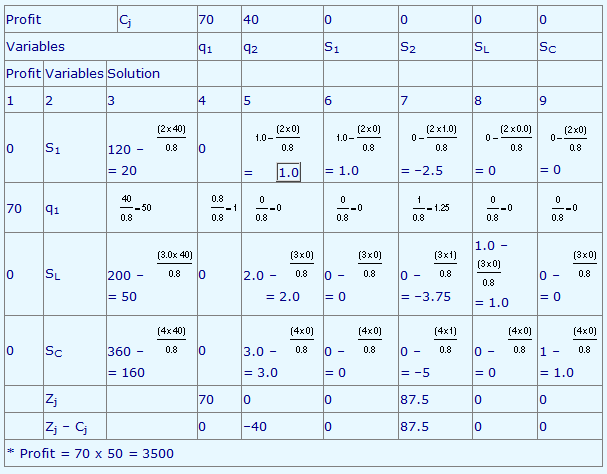
Tableau 2
Step 3: Find the variable to 'leave solution'
This is obtained by answering the following question:
In Step 2, let us decide to increase the value of q1, that is, increase the production level of type A castings. By how much can the production of type A castings be increased?
The answer is this: Increase the production until one of the resources gets exhausted. The requirement per unit of q1 is given in Column (4) of the tableau. If the value is positive, it means that there is a positive requirement. If the value is 0 or negative, it means that particular resources are not required for increasing the value of q1. By applying this simple logic, it is observed that the minimum positive ratio of the elements of Column (3) with the elements of the column selected in Step 2, that is, column (4) will indicate the resource which will be the first to be exhausted.
The minimum value is 50 corresponding to the ratio 40/0.8 and the corresponding variable is S2, that is, the resource raw material 2, gets exhausted by producing 50 units of type A castings. We cannot increase the value of q1 beyond 50 at this stage. As the value of S2 reduces to 0, we replace S2 by q1 in Column (2). We then identify the row corresponding to S2.
Step 4: Identify the pivot element
This is the one element common to the column identified in Step 2 and the row identified in Step 3, that is, 0.8. This element is circled in the table. The column and row where the pivot element lies are called pivot column and pivot row respectively.
We are now ready to update Tableau 1 and construct Tableau 2. The format of Tableau 2 is the same as Tableau 1. The rules for updating are explained below in Tableau 2.