Reference no: EM13982442
SECTION 1: QUIZ
1. A description of different houses on the market includes the following three variables. Which of the variables are quantitative?
a. the square footage of the house
b. the monthly gas bill
c. the monthly electric bill
d. all of the above
2. A survey records many variables of interest to the researchers conducting the survey. The following are some of the variables from a survey conducted by the U.S. Postal Service. Which of the variables is categorical?
a. the county of residence
b. the number of people, both adults and children, living in the household
c. the total household income, before taxes, in 1993
d. the age of respondent
3. Students at a University fill out a survey describing their personal computers. Some of the variables are responses to the following questions. Which of these variables is NOT categorical?
a. Who is the manufacturer of the computer?
b. Is the computer a laptop or a desktop model?
c. What is the memory capacity of the computer?
d. Does the computer have a CD/DVD writer?
Answer question 4 based on the histogram below.
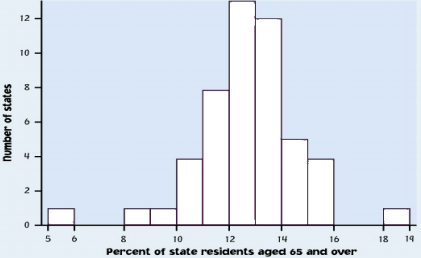
4. Consider the histogram above
• What are the "observations" here?
• Approximately how many states have values that fall between 13 and 19 percent?
• The total number of states represented by the total area of the bars is
Answer question 5 based on the histogram below.
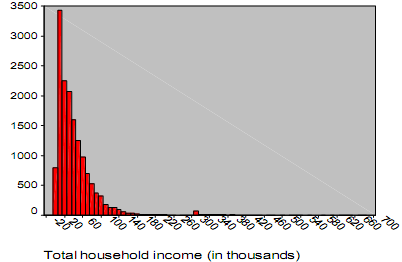
5. Consider the histogram above
• What are the "observations" here?
• Which variable's distribution is described by this histogram?
• The total area of the bars (that is, the heights of all the bars' added up) is equal to % of the sample size (that is, the total number of households in the sample).
• The shape of the distribution represented in the histogram is (symmetric or skewed to the left or skewed to the right?)
SECTION 2: SPSS PROJECT
In this project, you will summarize and report on a dataset called hw1_hrs2008sample (extension is .sav for SPSS).
• Download the data file to a local directory. Open SPSS and click File => Open => Data => ...hw1_hrs2008sample.
• There are 3 parts in this project, prepare your answers to each part.
• Only include the relevant information that helps answer the question, such as relevant SPSS graphs, statistics and explanations of those graphs and statistics.
• Try not to include raw SPSS outputs such as a long table of statistics that is returned in SPSS output window. Those raw outputs most likely include information that is more than necessary. For example, they could include statistics that are not asked for in the question, such as kurtosis, skewness, and confidence interval, etc. But if you decide to keep those additional statistics in your answer, you must explain what they mean and possibly why you want to include them in your answer.
Brief Data Description:
The data that you are using is a random sample from the Health and Retirement Study (HRS). The HRS is a survey to help study the behavior and well-beings of older Americans. Feel free to read more information about HRS following the llink: https://hrsonline.isr.umich.edu/. The dataset that you are using in this assignment, hw1_hrs2008sample, is a random sample from the HRS 2008 survey. All the variable names and descriptions are listed at the end of this assignment. You can easily find the same information from the SPSS "Variable View" window after you open the dataset.
Part I:
1) Identify FOUR variables for your analysis. Two of the four variables must be quantitative and two must be categorical. One variable you MUST choose is "educ" (i.e. education categories). Identify which variables are quantitative and which are categorical. For categorical variables, please specify they are nominal or ordinal.
2) Using SPSS, graph each of your four variables with an appropriate graph, and add all necessary labels and titles to your graphs. For the variable "educ", draw a bar chart. (Use SPSS Analyze/Descriptive Statistics/Frequencies => select the variable into the window, click on "Charts" => check the appropriate chart and value type setting => click "Continue" => click "OK").
3) For the bar chart of "educ", do the following: i) Arrange the "bars" in the chart in ascending or descending order according to the height of the bars; (ii) Attach a data label on each "bar" which must be in percentage terms (rather than counts).
3) Describe in words the overall patterns you observe in each graph, such as the share of the categories for categorical variables, and the shape, the approximate center, and the range of the distribution for quantitative variables.
Part II:
1) Choose one quantitative variable, and use SPSS to calculate the five-number summary as well as the mean and standard deviation. Report these seven statistics only.
(Use SPSS Analyze/Descriptive Statistics/Frequencies => select the variable into the window, click on "Statistics" => check the appropriate statistics required by this question, five-number summary and mean and standard deviation => click "Continue" => click "OK".)
2) Use SPSS to prepare a boxplot. With reference to the boxplot and the means and standard deviations, comment on the shape, the center, and the spread (range and standard deviation) of the distributions. Please include the outlier/s in the boxplot if there is any.
(Use Graphs => Chart Builder. In the pop-up window, click "OK". Select the Box Plot at the bottom. Choose the icon with the single box plot if you are graphing one variable (for example, BMI). Drag the single box plot icon to the canvas above.
Drag your variable (for example, BMI) and place it on the y-axis. Click on OK. Your chart will appear in the Output window.)
Part III:
1) Now compare males and females on the variable of BMI. Use SPSS to prepare a side- by-side boxplot. Report the mean, standard deviation, and five-number summary for males and females, respectively.
(To get means, standard deviations and five-number summary for males and females respectively, use SPSS Analyze/Descriptive Statistics/Explore => select your quantitative variable into the "Dependent List" window, and select the variable "gender" into the "Factor List" window => click "Statistics" => check on "Descriptives" and "Percentiles", click "Continue" => click "Plots" => click "Factor levels together" in the "Boxplots" panel, check off any other boxes if any has been pre-checked, now you can click "Continue" => click "OK". In your final answers, please do NOT keep the full (long) tables produced in SPSS as they may contain many statistics that you don't need at this moment. Make a new table in your Word file, report only the necessary statistics such as the mean, standard deviation, and five-number summary, for males and females, respectively.)
2) Comment on similarities and differences across BMI distributions by gender regarding shape, center, spread, and outliers (if any).
(To draw the boxplot to compare males and females, use Graph/Legacy dialog/Boxplot => click on "Simple" icon and check the box "Summaries for groups of cases", and then click "Define" => select the quantitative variable into "Variable" box, and select the variable "gender" into the "Category Axis" box, click "OK". You should then get the side-by-side boxplot for males and females. If necessary, change your vertical scale to make your graph look better.)
3) In the pair of boxplots you made above, change the "case number" attached to each outlier to the actual BMI values.
Data dictionary for the dataset hw1_hrs2008sample:
|
Variable
|
Description
|
|
Mstat
|
Marrital status of respondent. It has four categories: 1.married; 2.separated or divorced; 3.widowed; 4.never married.
|
|
Race
|
Race, Ethnicity: 1.white/Caucasian; 2.black/African American; 3.other.
|
|
Gender
|
1.male; 2.female.
|
|
Edyrs
|
Years of education
|
|
Educ
|
Education categories: 1.less than high-school; 2.GED; 3.high-school graduate; 4.some college; 5.college and above.
|
|
Age
|
Age of respondent
|
|
Shlt
|
Self-reported health status: 1.excellent; 2.very good; 3.good; 4.fari; 5.poor.
|
|
Bmi
|
Body Mass Index
|