What are the new values of the mean and median

Assignment Help Basic Statistics
Reference no: EM131302119

Q1. Which of these data sets has a higher mean? Higher median? Higher standard deviation? (Do not do any calculations. Just look at the data.)

x

1

2

3

4

5

y

5

4

3

2

1

358_Figure.png

Q2. Which of these data sets has a higher mean? Higher median? Higher standard deviation? (Do not do any calculations. Just look at the data.)

x

1

2

3

4

5

y

1

2

3

4

6

Q3. Suppose that you have 10 observations that have a mean of 7, a median of 6, and a standard deviation of 3. If you double the value of each observation, what are the new values of the:

a. Mean?

b. Median?

c. Standard deviation?

Q4. Suppose that you have 10 observations that have a mean of 7, a median of 6, and a standard deviation of 3. If you halve the value of each observation, what are the new values of the:

a. Mean?

b. Median?

c. Standard deviation?

Q5. Identify the apparent statistical mistake in this commentary [13]:

The median cost of a house in [Duarte, California] is a whopping $4,276,462, making it the most expensive housing market in the country. It ranks No. 1 on Forbes' annual ranking of America's Most Expensive ZIP Codes.. [O]nly 12homes are currently on the market. So a single high-priced listing (like the mammoth nine-bedroom, built this year, that's selling for $19.8 million) is enough to skew the median price skyward.

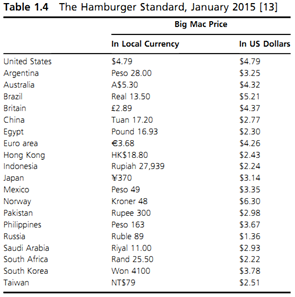
Q6. Table 1.4 shows the US dollar prices of Big Mac hamburgers in 20 countries. Use a box plot to summarize these data.

1456_Figure1.png

Q7. Figure 3.11 shows two box plots. Which data set has the higher median? The higher standard deviation?

1934_Figure2.png

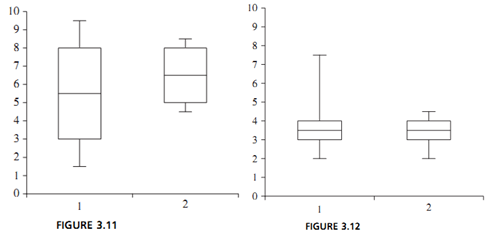
Q8. Figure 3.12 shows two box plots. Which data set has the higher median? The higher mean? The higher standard deviation?

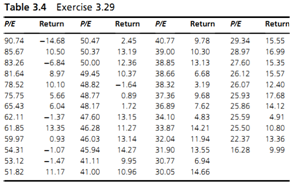
Q9. Use the data in Exercise 3.29 to make a scatter diagram with the P/E ratio on the horizontal axis and the return on the vertical axis. Does there appear to be a positive relationship, negative relationship, or essentially no relationship?

1380_Figure3.png

Q10. Explain the error in the conclusion reached by a security analyst [16]:

The Dow Jones Industrial Average peaked at 381.17 during September 3, 1929. The so-called Great Crash pushed this index down 48% by November 13. But, by April17, 1930, the index rebounded 48% from the November bottom. In other words, anyone who bought a diversified portfolio of stocks during September 1929would have experienced no net change in the value of his portfolio by April of1930.

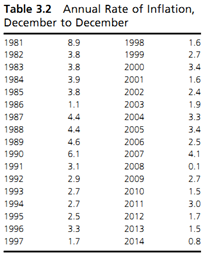
Q11. Use the data in Table 3.2 to determine the percentage annual rate of increase in the CPI between 1990 and 2014.

2123_Figure4.png

Q12. A 1989 radio commercial claimed: "If you have a Life Alert security system, your chances of becoming a victim of a serious crime are 3000 to 4000 percent less than your neighbor's." Is this possible?

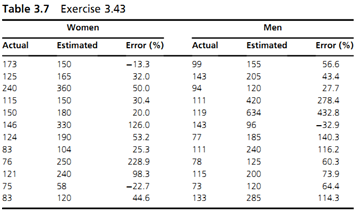
Q13. Twelve college women and men were asked to read a short article and, when they were finished, estimate how long it took them to read the article. Table 3.7 shows the actual and estimated times (both in seconds) and the percentage difference between the two. Summarize the percentage error data with two side-by-side box plots, one for women and one for men.

477_Figure5.png

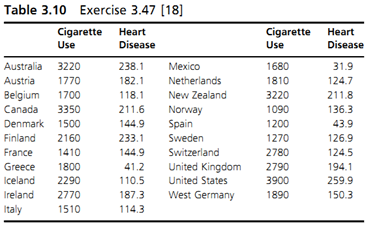
Q14. The data in Table 3.10 were used in the 1964 Surgeon General's Report warning of the health risks associated with smoking, where the first variable is annual per capita cigarette consumption and the second variable is deaths from coronary heart disease per 100,000 persons aged 35 to 64. Calculate the correlation. Does the value of the correlation suggest that there is a positive relationship, negative relationship, or essentially no relationship between cigarette consumption and heart disease?

338_Figure6.png

Q15. If y ¼ 10 - 3x, then the correlation between x and y is:

a. 1.

b. 0.

c. 1.

d. Un-defined.

Q16. Explain how the following two newspaper headlines that appeared on the same day could both be accurate: "Orders for Machine Tools Increased 45.5% in October" [19]; "October Orders for Machine Tools Decreased 29%" [20].

Reference no: EM131302119

Questions Cloud

What action research or organizational step was missing : What action research or organizational step was missing and  Why missing this step might have led to failure. Which is immediately implemented. However, six months later sales are still down.
Would a different strategy be more effective : Describe how an organization's vision and mission facilitate the development of a HR management strategy. How does the lack of a vision and mission statement affect HR-business strategy? Use examples to illustrate your views.
Why are all massless particles stable : Massless particles must travel at the speed of light, while others cannot reach this speed. Why are all massless particles stable? If evidence is found that neutrinos spontaneously decay into other particles, would this imply they have mass?
Is a hadron always a baryon : Explain how conservation of baryon number is responsible for conservation of total atomic mass (total number of nucleons) in nuclear decay and reactions.
What are the new values of the mean and median : Suppose that you have 10 observations that have a mean of 7, a median of 6, and a standard deviation of 3. If you halve the value of each observation, what are the new values of the: Mean? Median? Standard deviation
Determine the needed leadership style : Thoroughly analyze the situation and the needed areas of improvement. Determine the needed leadership style to help develop a solution. Outline an action plan for a resolution.
Why should we bother to perform experiments : What lifetime do you expect for an antineutron isolated from normal matter?
Draw a plot showing sustained oscillations : Use the Ziegler-Nichols (Z-N) method to find Ku and Tu. Draw a plot showing sustained oscillations and period of the oscillations. An example plot is shown in figure 3.5. Provide the values of Ku and Tu.
Compare the prompt radiation yields : A radiation-enhanced nuclear weapon (or neutron bomb) can have a smaller total yield and still produce more prompt radiation than a conventional nuclear bomb.

Reviews

Write a Review

Basic Statistics Questions & Answers

  Emerging financial markets and investment

The aim of the project is to allow you to test a theory or hypothesis, perhaps learnt from one of your theory-based modules (e.g. Global Risk Analysis, Emerging Financial Markets and Investment, Global Financial Markets), using the methods we have..

  Probability that more than five will be sick on given Friday

the past many years, the average number of employees absent on Friday is 2.6. Given this data she asks you to compute the probability that more than 5 will be sick on a given Friday.

  An electrical engineer has two boxes containing different

an electrical engineer has two boxes containing different types of resistors. the first box contains 3 resistors of one

  Would t-test or chi-square tests for differences appropriate

What inferential statistical tests are appropriate to answer your research question as to whether past participation and contribution will make a difference in people enjoying, and supporting an event?

  Define relative frequency histogram graphical methods

Define the following graphical methods and describe how they are used- Histogram and Relative frequency histogram

  Least square method to find regression

Assume a linear relationship, use the least square method to find the regression coefficients bo and b1 and Predict the mean kilowatt usage when the average temperature is 50 degrees Fahrenheit.

  Explain how the decision analysis model

You are working again with your project management e-group, and members are eager to learn how things are faring with your project. Others of the group are at an evaluative stage of their respective projects too, so you will read of their work as ..

  Find the standard normal area for each of the following

find the standard normal area for each of the following round your answers to 4 decimal places.standardnormal areaa

  Utilizing exponential smoothing constant for different value

Forecast the number of deliveries utilizing exponential smoothing constant for different values also compare it. A hospital records the number of floral deliveries its patients receive every day.

  Find the sel predictor of y based on x you need to evaluate

below is a table giving a joint pmf for the random pair yx.x1x2x3y3.05.2.1y2.1.1.11y1.15.1.09a find the sel predictor

  A new grug had a potency advertised at 75 given the

a new grug had a potency advertised at 75. given the following smaple datan25x bar 76.6s1a check manufacturers claim

  How large a sample is required if we want to be 95% confiden

The mean and standard deviation for the quality point averages of a random sample of 36 college seniors are calculated to be 2.6 and 0.3

Free Assignment Quote

Assured A++ Grade

Get guaranteed satisfaction & time on delivery in every assignment order you paid with us! We ensure premium quality solution document along with free turntin report!

All rights reserved! Copyrights ©2019-2020 ExpertsMind IT Educational Pvt Ltd