Reference no: EM131056320
Question 1-
(a) Explain the concepts of beta risk (in terms of the capital asset pricing model (CAPM)) and diversifiable risk and how each relates to the relationship between total investment risk and expected return.
(b) Discuss the limitations inherent in the CAPM approach to assessing risk?
Question 2-
As an analyst you receive the following regression information:
E(Yt) = β1 + β2Xt was estimated by the ordinary least squares method as:
Y^t = 227.3642 + 6.4075 Xt
∑(Xt)2 - nx-2 ≈ 33.43
Se2 ≈ 35.4198
Degrees of freedom = n - 2 = 10
(a) Perform a two-tail test of the null hypothesis H0: β2 = 0 against the alternative H1: β2 ≠ 0 with α = 0.05. Find the value of the t-statistic and the associated critical value for the test. Conclude whether the null hypothesis can be rejected at the 5% level.
(b) Perform a one-tail test of the null hypothesisH0: β2 = 0 against the alternative H1: β2 > 0 with α = 0.05. Find the value of the t-statistic and the associated critical value for the test. Conclude whether the null hypothesis can be rejected at the 5% level.
(c)Construct a 95% confidence interval for β2.
Note: You must show all workings for each part of the question.
Question 3-
Bauman and Miller (1994) examine the hypothesis of modern portfolio theory that portfolio returns are positively correlated with risk as measured by beta (systematic risk) and sigma (standard deviation of return). They analyse how well portfolio returns in one market cycle are predicted by portfolio returns, sigma and beta in the previous market cycle, using a regression model. They conclude:
Measuring and ranking the returns of portfolios over stock market cycles is very useful in predicting rankings and returns over the next market cycle; this is generally more useful than employing portfolios' betas and sigmas for prediction purposes. Predictions of portfolio returns are highly significant in all the market cycles when past returns are used in conjunction with portfolio sigmas, however.
Explain how the figures in the exhibits (below) from the Bauman and Miller paper support their conclusions with regard to:
(a) Treynor ratio (from Exhibit 4).
(b) Predicted returns from beta and sigma (from Exhibits 5, 6 and 7).
(c) Portfolio returns measured over the data period (from Exhibit 7).
(d) Portfolio returns, sigma, and beta in the previous market cycle (from Exhibit 7).
Note: You will need to understand the paper as a whole before you can interpret the exhibits. You can draw on exhibits other than the ones listed above if you wish. You must indicate which columns and figures are relevant to the conclusions for full marks.
Reference: Bauman, WS & Miller, RE 1994, 'Can managed portfolio performance be predicted?', The Journal of Portfolio Management, vol. 20, no. 4, pp. 31-40.
Question 4-
You are assigned the task of predicting the stock return for the raw materials sector. You propose that the raw materials sector stock returns are explained by the following four explanatory variables:
- industrial production growth rate
- 10-year Treasury bond yields
- inflation rate
- the spread in yields between BB rated bonds and AAA rated bonds.
You run a multiple linear regression using 120 monthly observations (n) with the following results.
|
Explanatory variable
|
Regression coefficient
|
Standard error
|
|
Constant
|
2.00
|
1.25
|
|
Industrial production growth rate %
|
3.25
|
1.30
|
|
10-year treasury bond yields %
|
-0.50
|
0.20
|
|
Inflation rate %
|
0.28
|
2.00
|
|
Yield spreads %
|
-0.20
|
2.05
|
For the questions below, show full workings and explain the approach you take, including the reasons why particular statistics are used. You may utilise the template provided in the 'Q4' tab of the Excel spreadsheet, but you should present your answer, along with all workings (and formulas) in the assignment template.
(a) From the data provided in the table above, calculate the t-statistic for the four (4) regression coefficients.
(b) Which coefficient estimates are statistically significant at the 0.05 level?
(c) What is the 95% confidence interval for the industrial production growth rate slope?
(d) You make the following predictions:
- constant 1.0%
- industrial production growth rate 0.5%
- 10-year Treasury bond yield 4.0%
- inflation rate 3.0%
- yield spread 5.0%
Based on these predictions and the regression results in the table above, what do you predict the raw materials sector return will be?
(e) Given the regression results in the table above, what is the expected change in the raw materials sector return in response to a one percentage point decrease in the industrial production growth rate (assuming no change in the remaining explanatory variables)?
Question 5-
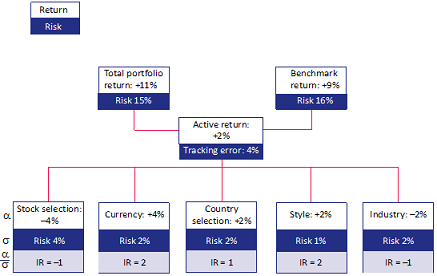
After analysing the management of the investment portfolio, shown in the diagram above:
(a) Explain the overall result of the active management.
(b) Describe the strengths and weaknesses of the portfolio manager as indicated by returns. What actions might be taken on the basis of this analysis?
(c) What is an information ratio and how is it used in portfolio management? Describe the strengths and weaknesses of the portfolio manager as indicated by information ratios.
Resources for Questions 6, and 7-
Note: The construction of the model for this assignment is based on a number of underlying assumptions.
You have been provided with data on a number of stocks to build a model for the following questions, although not all stocks are used for all questions. The data to enable you to answer Questions 6 and 7. Data in different tabs is used for different questions.
The model will hold a portfolio of some of these 10 stocks, the returns of which are considered to be random variables. The volatility of the portfolio return is selected as a measure of risk.
Stock price movements are assumed to be related to a total of three explanatory variables (or factors) - size, momentum and value, defined below:
- size: the logarithm of the market capitalisation, which is the number of shares issued, multiplied by the share price. LOG or LOG10 Excel functions are applied instead of the LN Excel function
- momentum: the rolling three-month price return, which is the percentage change of the current price from the price three months ago
- value: the earnings yield, which is the percentage earnings per share divided by the price per share.
The monthly data provided for this assignment are for the 96 months from January 2001 to December 2008. The monthly data are split into two periods:
- in-sample period (84 months from January 2001 to December 2007)
- out-of-sample period (12 months from January 2008 to December 2008).
In this regression model, monthly returns can be considered as a linear combination of the three explanatory variables and a specific return (random error). Once the model for each stock is estimated, the portfolio risk of the stocks can be calculated simply by using the:
- covariance matrices of the three common factors' coefficients
- associated three common factors' exposures (matrix of observations on the independent variables)
- covariance matrix of specific returns.
Note: A model-based covariance matrix of total returns is used for risk analysis (rather than the historic data-based covariance matrix) for the 10 stocks.
In order to estimate the covariance matrix of the three factors' coefficients, a sample of the coefficients of the three common factors from the cross-sectional regressions has to be obtained. Using the ordinary least squares (OLS) method for each month over the in-sample period, 10 stock returns (the dependent variables) are regressed against the associated three factors' exposures. These cross-sectional regressions are repeated for each month over the in-sample period.
The covariance matrix of the three regression coefficients is estimated, based on the monthly regression coefficients over the different months. With the three factors' exposures, the 'common factor' covariance matrix can be calculated at any month. The covariance matrix of specific returns is added to the common factor covariance matrix to obtain the model-based covariance matrix of total returns at any month.
The results obtained are then used to forecast the volatility of monthly returns of each stock and/or a portfolio of stocks at a month over the out-of-sample period, given certain values of the three factors' exposures.
Note:
- no prior knowledge of risk-factor modelling is assumed
- express returns and their volatilities as percentages to two (2) decimal places
- report all elements in the correlation and covariance matrices to six (6) decimal places
- be consistent in the use of measurement units for all calculations.
Question 6-
(a) The 'Q6a' tab in the Excel spreadsheet provides the summary statistics of 84 regressions based on cross-sectional data for each month between January 2001 and December 2007. The following summary statistics are shown in the spreadsheet:
- multipleR
- R-square
- adjusted R-square
- standard error
- significance of F.
Define each of the above terms and interpret each of the statistics in regards to the data over the time period from January 2001 to December 2007.
(b) (i) Consider the following notations:
Ri = return of stock i for a particular month
Xi1 = exposure of stock i to the constant unit of 1
Xi2 = exposure of stock i to the size
Xi3 = exposure of stock i to the momentum
Xi4 = exposure of stock i to the value
f1 = the intercept term
f2 = the regression coefficient of size
f3 = the regression coefficient of momentum
f4 = the regression coefficient of value.
Complete the formula for the specific returns (or residual term) of stock i for a particular month, Ui, given the information above and the linear regression model. What do the specific returns attempt to measure?
(ii) Calculate the monthly specific returns (i.e. the residuals of the regressions) for CBA, WES and BHP for the 84-month in-sample period. To do this calculation, use the formula derived from part (i), the data given in the notations in part (i), and the data in the 'Q6b' tab of the Excel spreadsheet.
From your Excel results, paste a copy of the specific returns for CBA, WES and BHP for the months of January 2001 and December 2007onlyin the Word document of your assignment (and in the format below).
|
Month
|
CBA
|
WES
|
BHP
|
|
Jan. 2001
|
|
|
|
|
Dec. 2007
|
|
|
|
(c) Calculate the historical covariance of the monthly specific returns for CBA, WES and BHP for the 84 month in-sample period.
From your Excel results, paste a copy of the monthly specific returns covariance matrix for CBA, WES and BHP in the Word document of your assignment (and in the format below). See the 'Q6c-d' tab of the Excel spreadsheet.(3 marks)
|
|
Monthly specific returns covariance matrix
|
|
|
CBA
|
WES
|
BHP
|
|
CBA
|
|
|
|
|
WES
|
|
|
|
|
BHP
|
|
|
|
(d) Calculate the historical annualised volatility (standard deviation) of the monthly specific returns for CBA, WES and BHP for the 84 month in-sample period.
From your Excel results, paste a copy of the annualised specific returns volatilities for CBA, WES and BHP in the Word document of your assignment (and in the format below). See the 'Q6c-d' tab of the Excel spreadsheet.
|
|
Annualised specific returns volatilies
|
|
|
CBA
|
WES
|
BHP
|
|
CBA
|
|
|
|
|
WES
|
|
|
|
|
BHP
|
|
|
|
Question 7-
Answer the questions below, providing reasons and valid arguments to demonstrate your understanding of regression limitations and how to manage them in practice.
(a) Describe the four (4) conditions that must be satisfied for a regression analysis to be valid.
(b) Describe two (2) ways of dealing with heteroscedasticity.
(c) Calculate the rolling 12-month volatility of price returns for each of the 10 stocks over the in-sample period using data in the 'Q7' tab in the Excel spreadsheet.
Note: The rolling 12-month volatility at any month is the annualised standard deviation using the monthly returns of the preceding 12 months.
Save your Excel workings for part (c) as a tab labelled '7c'.
(d) Draw a graph of the results in part (c).Based on the graph, describe the relationship between volatilities of stocks over time.
(e)Explain the Durbin-Watson test and how its results should be interpreted.
(f) Why would a transformation of the dependent variable be used? Describe what sorts of transformations are commonly used.
(g) Explain four (4) steps in a backward elimination stepwise regression approach.
Question 8-
Use Figure 1 to answer the questions below.
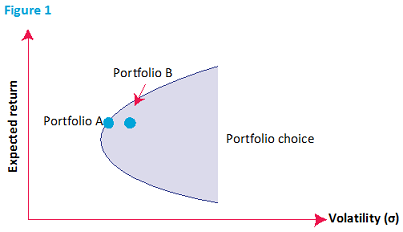
(a) (i) What does Figure 1 depict and what is the financial name or description given to the diagram?
(ii) Which portfolio (A or B) would be preferred and why?
(b) Explain how volatility is measured with respect to Figure 1.
(c) (i) A portfolio manager decides to allocate superannuation funds of their recent clients who are more risk averse than average. What would the portfolio manager need to do to achieve this outcome?
(ii) Briefly state where this portfolio of assets would be represented with respect to Figure 1.
Question 9-
Assume that we have estimated the following AR(1) model:
Xt = 0.0825 + 0.7654Xt - 1 + et
Furthermore, assume that the current level of X is 0.4968.
(a) Forecast the value of X at time 1 (X1) and time 4 (X4).
(b) Which of these two forecasts is likely to be more reliable? Why?
(c) What is serial correlation? How do we test for its presence in this model?
(d) What is the mean reverting level of this model? What does this mean?
Required reading- Can Managed Portfolio Performance Be Predicted? Performance should be evaluated over complete stock market cycles. By W. Scott Bauman and Robert E. Miller.
Attachment:- Assignment.rar