How consumer surplus relates to values and costs

Assignment Help Microeconomics
Reference no: EM13751540

1. How consumer surplus relates to values and costs

The following graph shows the market for high heels. The downward-sloping (blue) line represents demand, and the upward-sloping (orange) line represents supply. The market is perfectly competitive and currently in equilibrium at a price of $50 per pair.

On the graph, use the green triangle (triangle symbols) to shade in the area representing consumer surplus. Tool Tip: You can mouse over the shaded region on the graph to find its area.

1320_How consumer surplus relates to values and costs.png

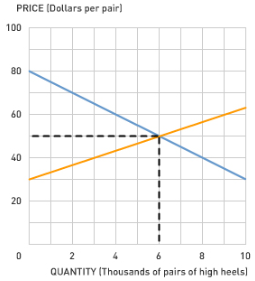
At a price of $50, all consumers who choose to buy a pair of high heels value them at . Given this information, consumer surplus in this market is . (Hint: Note the units on the X-axis.)

It must be the case that for each firm that produces high heels, the of the last pair of high heels produced is

True or False: When the price of a pair of high heels is $55, there is no deadweight loss in this market.

2. Elasticity and total revenue

545_How consumer surplus relates to values and costs1.png

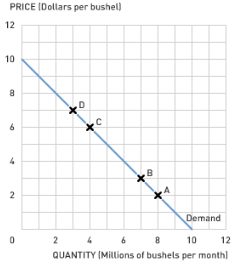
The following graph shows the demand curve for kumquats. You can use the red rectangle labeled Total Revenue (cross symbols) to compute total revenue at various prices along the demand curve. To see the area of the Total Revenue rectangle, scroll over the shaded area with your mouse. You will not be graded on where you place the rectangle.

The price elasticity of demand between points C and D is approximately

Suppose the price of kumquats is currently $3 per bushel. Because the price elasticity of demand between points A and B is , a $1-per-bushel fall in price will lead to in total revenue per month.

In order for a price increase to cause an increase in total revenue, demand must be

3. Producer surplus for an individual and a market

1284_How consumer surplus relates to values and costs2.png

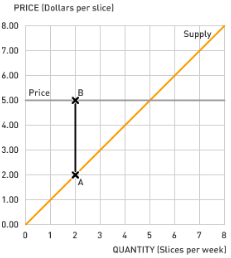
Suppose the market for apple pie is a perfectly competitive market. Jared owns a restaurant where he sells apple pie. The orange line on the following graph shows Jared's supply curve. The price of apple pie is $5.00 per slice, as shown by the horizontal grey line.

From the graph, you can tell that Jared's marginal cost of supplying his second slice of apple pie each week is

. Since he receives $5.00 per slice, the producer surplus he gains from supplying the second slice of apple pie is

Suppose the price of apple pie were to rise to $7.00 per slice. At this higher price, Jared would receive a producer surplus of from his second slice of apple pie. At the higher price, the quantity of apple pie supplied by Jared would

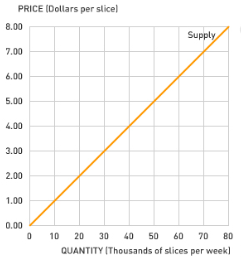
The orange line on the following graph shows the market supply of apple pie in a small economy. Using the purple triangle (diamond symbols), shade the area representing producer surplus if the price of apple pie is $5.00 per slice. Then, using the green quadrilatera (triangle symbols), shade the area representing additional producer surplus if the price rises to $7.00 per slice.

2491_How consumer surplus relates to values and costs3.png

4. Consumer surplus for an individual and a market

39_How consumer surplus relates to values and costs4.png

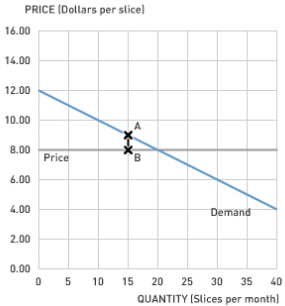
The blue line on the following graph shows Ralph's demand for cheesecake. The price of cheesecake is $8.00 per slice, as shown by the horizontal grey line.

From the graph, you can tell that Ralph's marginal benefit from his 15th slice of cheesecake each month is

. Since he only has to pay $8.00 per slice, the consumer surplus he gains from the 15th slice of cheesecake is

Suppose the price of cheesecake were to fall to $6.00 per slice. At this lower price, Ralph would receive a consumer surplus of from his 15th slice of cheesecake. At the lower price, Ralph would also the amount of cheesecake he buys.

The blue line on the following graph shows the market demand for cheesecake in a small economy. Using the purple triangle (diamond symbols), shade the area representing consumer surplus if the price of cheesecake is $8.00 per slice. Then, using the green quadrilateral (triangle symbols), shade the area representing additional consumer surplus if the price falls to $6.00 per slice.

Reference no: EM13751540

Questions Cloud

Write a paper that identifies a governmental agency : Regulatory Agency Paper. Prepare a 1,400-1,750 word paper that identifies a governmental or other agency (e.g. JCAHO) that governs the health care industry.
Issuing an audit opinion for the company : Auditors have come into a department as part of a company-wide audit prior to issuing an audit opinion for the company's financial reports.
Explore the cloud technology concept : In a four to five page paper, address the following areas: Please explain how you will be utilizing technology to make your business more effective and efficient. Explore the cloud technology concept
Financial management for ordinary business : We have discussed many times the distinctions between financial management for ordinary business and financial management for health care-based businesses.
How consumer surplus relates to values and costs : Graph shows the market for high heels. The downward-sloping (blue) line represents demand, and the upward-sloping (orange) line represents supply. The market is perfectly competitive and currently in equilibrium at a price of $50 per pair.
Nominal rate of interest : What would you expect the nominal rate of interest to be if the real rate is 3.8% and the expected inflation rate is 7.4%? (Round to nearest decimal place)
Write a technology roadmap : Write a technology roadmap based on how you see the technology would evolve in the market
Define make-to-stock and make-to-order systems : Compare and contrast between make-to-stock and make-to-order systems. In your comparison, why does each system require different types of contracts
Create website with ajax chat : Need to create website with Ajax chat

Reviews

Write a Review

Microeconomics Questions & Answers

  Detailed optimization calculations

Compute output, marginal cost, average cost, price, and profit at the average cost-minimizing activity level. Compute these values at the profit-maximizing activity level.

  United states and russia are considering policies to open

United States and Russia are considering policies to open or close their import markets. Suppose the payoff matrix has payoffs of x,y, where X is the payoff to the US and Y the payoff to Russia

  Consider a homogeneous product industry with inverse market

consider a homogeneous product industry with inverse market demand given by p 1100 - 2qnbsp there is currently one

  Aerotron electronics is considering purchasing a water

aerotron electronics is considering purchasing a water filtration system to assist in circuit board manufacturing. the

  Is this rule based policy pro-cyclical or countercyclical

Draw an AD/AS graph and a money market graph side-by-side. For the money market, use an upward sloping money supply curve and assume that the equilibrium interest rate in the money market is 5%.

  Compute and illustrate mpl and apl

Let q=K^(.75)*L^(.25) denote the production function, and w and r denote the prices of K (captial) and L (labor). Suppose K is fixed at 10 and L is variable. Compute and illustrate MPL and APL

  Two firms choose their quantities simultaneously

Two firms, i = 1,2, produce the same good. Each firm i's cost of producing quantity q_{i} is given by C_{i}(q_{i}) = q{_{i}}^{2} . The market demand is given by P_{d}(Q) = a-Q for all Q = q_{1} + q_{2}\leq a (with P_{d}(Q) = 0 for Q> a).

  An economy is faced by exhaustion of an important natural

An economy is faced by exhaustion of an important natural resource at a time when it is introducing improved technology.explain how these events will effect the economy production possibility curve.

  Applying the principles of keynesian model what specific

suppose that you are the chief economic advisor to the president of the united states. you are asked to propose a

  Explain what the rate of money growth should equal

At times, people will suggest that the Fed should try and achieve an inflation rate of zero percent. If we assume that velocity is constant, does this goal of zero inflation require that the rate of money growth equal zero.

  Important to study international financial management

Why is it important to study international financial management? How is international financial management different from domestic financial management? Please provide specific examples.

  Define the production possibilities curve

Compare the movement from b to c and from e to f. What do you notice about opportunity cost? Explain and how can an economy achieve points that are outside the production possibilities curve?

Free Assignment Quote

Assured A++ Grade

Get guaranteed satisfaction & time on delivery in every assignment order you paid with us! We ensure premium quality solution document along with free turntin report!

All rights reserved! Copyrights ©2019-2020 ExpertsMind IT Educational Pvt Ltd