Examine the graph of marginal benefits

Assignment Help Microeconomics
Reference no: EM13521134

1. Regulators are considering controlling the emissions from two local power plants. The marginal benefits (the demands for effluent) derived by these plants from being able to produce a given quantity of effluent are 10,000-Q1 for the first plant and 10,000-2*Q2 for the second facility (where Q1 and Q2 are the quantities of effluent).

a. Graph these two individual pollution demand curves and indicate the levels of pollution (both graphically and numerically) that will be produced by these plants in the absence of regulation.

b. Find the total demand function for effluent implied by these two individual firm demand functions and add it to the graph above.

c. Suppose that the damage from the effluent is MC=1*(Q1+Q2)=Q. Add this function to the graph in part (a). What is the efficient level of effluent?

d. Regulators are considering a policy that obligates each plant to limit its emissions to half of the efficient level of total pollution you found in the previous question. Illustrate this policy on a new graph and calculate the total control (abatement) costs of this policy.

e. Acting as a consultant to regulators, you suggest that an alternative might be to impose a tax on each unit of effluent. What would the tax be if it were set at the level to achieve the efficient total amount of effluent? How much effluent would be produced by the two firms?

f. Calculate the abatement costs under the tax policy and compare their total to that achieved under the command and control policy in (d). Which policy is more cost effective? Why do you expect this finding to be true in general?

2. Two very different commercial sectors produce a common airborne pollutant located in two different geographic regions. One has marginal benefits of pollution of 1000-2e1 while the other has marginal benefits of 800-e2.

a. Write the equation for the total demand for emissions across both sectors. Does one sector have uniformly lower marginal abatement costs than the other? What is the total amount of emissions in the absence of regulation? 

b. A cap and trade program is created with an initial allocation of 1000 permits. After trading occurs, what will be the market price of a unit of quota? How much will each sector emit?

c. Assuming that the initial allocation of quota was proportional to the historical shares of pollution in the previously unregulated market, who is a buyer and a seller in part b and how much quota changes hands?

d. It is later found that the marginal damage function from emissions is MD=(e1+e2)=E. How does the efficient level of emissions compare to the level achieved under the cap and trade policy above? Graphically, depict the net loss to society (the deadweight loss in econ-speak) from over/under abatement of pollution.

3. The owner of a tropical forest harvests timber so as to maximize his own profit from the land. This forested land also provides habitat for wild beehives that pollinate the crops of surrounding farmers. Assume that the number of bees and therefore the magnitude of the pollination services provided are proportional to the size of the intact forest habitat on the landowner's property. In the absence of an agreement between the landowner and his neighbors, is he likely to harvest too much or too little of his timber at any given time? Characterize this as an example of a positive or a negative externality.

4. The efficient level of a negative externality is always a positive amount (circle one: True/False). Briefly explain your answer.

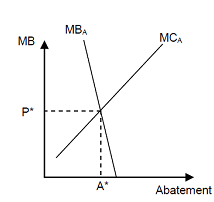
5. Examine the graph of marginal benefits and costs of abatement below. Suppose regulators expect these curves to be as shown but are uncertain as to whether or not the marginal costs of abatement curve will be higher or lower than depicted. If regulators must choose between an emissions tax or tradable quotas, which would be preferred from the perspective of efficiency, given the uncertainty in costs of abatement? Explain in a short paragraph and illustrate on this graph.

2321_Examine the graph of marginal benefits.png

Reference no: EM13521134

Questions Cloud

Write the equation for the total demand for emissions : Write the equation for the total demand for emissions across both sectors. Does one sector have uniformly lower marginal abatement costs than the other? What is the total amount of emissions in the absence of regulation?
Graph individual pollution demand curves : Graph these two individual pollution demand curves and indicate the levels of pollution (both graphically and numerically) that will be produced by these plants in the absence of regulation.
Find the angles of reflection at the surfaces : A ray of light strikes the midpoint of one face of an equiangular (60°-60°-60°) glass prism (n = 1.5) at an angle of incidence of 32.5°. find the angles of reflection at the surfaces
Social problems claimsmaking : The focus of social problems work differs from that of social problems claimsmaking
Examine the graph of marginal benefits : Examine the graph of marginal benefits and costs of abatement below. Suppose regulators expect these curves to be as shown but are uncertain as to whether or not the marginal costs of abatement curve will be higher or lower than depicted
Find what must be the diameter of the wire : A 54.0 g sample of a conducting material is all that is available. The resistivity of the material is measured to be 11 10-8 ·m, What must be the diameter of the wire
Discuss the eight steps in the research model : Discuss the eight steps in the research model.
Determine how far away from you is your image : As you get ready for your early morning physics class, you comb your hair in front of a planar mirror. How far away from you is your image
Explain the internal standard calibration method : What would be the advantages of the internal standard calibration method and explain why the technique works so well in GC

Reviews

Write a Review

Microeconomics Questions & Answers

  The free rider problem

Question: Explain why the free rider problem makes it difficult for perfectly competitive markets to provide the Pareto efficient level of a public good.

  Failure of the super committee is good thing for economy

Some commentators have argued that the failure of the “Super committee” is good thing for the economy?  Do you agree?

  Case study analysis about optimum resource allocation

Case study analysis about optimum resource allocation: -  Why might you suspect (even without evidence) that the economy might not be able to produce all the schools and clinics the Ministers want? What constraints are there on an economy's productio..

  Fixed cost and vairiable cost

Questions:  :   Which of the following are likely to be fixed costs and which variable costs for a chocolate factory over the course of a month?  Explain your choice.

  Problem - total cost, average cost, marginal cost

Problem - Total Cost, Average Cost, Marginal Cost: -  Complete the following table of costs for a firm.  (Note: enter the figures in the  MC   column  between  outputs of  0 and 1, 1 and 2, 2 and 3, etc.)

  Oligopoly and demand curve problem

Problem based on Oligopoly and demand curve,  Draw and explain the demand curve facing each firm, and given this demand curve, does this mean that firms in the jeans industry do or do not compete against one another?

  Impact of external costs on resource allocation

Explain the impact of external costs and external benefits on resource allocation;  Why are public goods not produced in sufficient quantities by private markets?  Which of the following are examples of public goods (or services)? Delete the incorrec..

  Shifts in demand and movements along the demand curve

Describe the differences between shifts in demand and movements along the demand curve. What are the main factors which can shift the demand curve? Explain why they cause the demand curve to shift. Use examples and draw graphs to support your discuss..

  Article review question

Article Review Question: Read the following excerpts from the article "Fruit, veg costs surge' by Todd, Dagwell, published in the Herald on January 25th 2011 and answer questions below:

  Long-term growth, international trade & globalization

Long-term Growth, International Trade & Globalization:- This question deals with concepts such as long-term growth, international trade and globalization. Questions related to trade deficit, trade surplus, gains from trade, an international trade sce..

  European monetary union (emu) in crisis

"Does the economic bailout of Spain and Greece spell the beginning of the end for the European Monetary Union (EMU)?"

  Development game “settlers of catan”

Read the rules of the game, the overview and the almanac for the Development Game "Settlers of Catan"

Free Assignment Quote

Assured A++ Grade

Get guaranteed satisfaction & time on delivery in every assignment order you paid with us! We ensure premium quality solution document along with free turntin report!

All rights reserved! Copyrights ©2019-2020 ExpertsMind IT Educational Pvt Ltd