Draw the box-plots for age and and fat

Assignment Help Engineering Mathematics
Reference no: EM131035621

Problem 1:  This problem is an example of data preprocessing needed in a data mining process.  

Suppose that a hospital tested the age and body fat data for 18 randomly selected adults with the following results:

Age

23

23

27

27

39

41

47

49

50

%fat

9.5

26.5

7.8

17.8

31.4

25.9

27.4

27.2

31.2

Age

52

54

54

56

57

58

58

60

61

%fat

34.6

42.5

28.8

33.4

30.2

34.1

32.9

41.2

35.7

a. Draw the box-plots for age and %fat.  Interpret the distribution of the data

b. Normalize the two attributes based on z-score normalization.

c. Regardless of the original ranges of the variables, normalization techniques transform the data into new ranges that allow to compare and use variables on the same scales. What are the values ranges of the following normalization methods? Explain your answer.

i. Min-max normalization

ii. Z-score normalization

iii. Normalization by decimal scaling.

d. Draw a scatter-plot based on the two variables and interpret the relationship between the two variables.

e. Calculate the correlation coefficient. Are these two attributes positively or negatively correlated? Compute the covariance matrix.

Problem 2:  This problem is an example of data preprocessing needed in a data mining process.  

Suppose a group of 12 sales price records has been sorted as follows:

5, 10, 11, 13, 15, 35, 50,55,72,92,204,215

Partition them into bins by each of the following method, smooth the data and interpret the results:

a. equal-depth partitioning with 3 values per bin

b. equal-width partitioning with 3 bins

Problem 3 a) Figure 1 illustrates the plots for some data with respect to two variables: balance and employment status. If you have to select one of these two variables to classify the data into two classes (circle class and plus class), which one would you select? Is there any approach/criterion that you can use to support your selection? Explain your answer.

822_Figure.png

Figure 1: Data Plots for Problem 3.a.

b) For the data in Figure 2 with three variables and two classes: which variable you would choose to classify the data? Show all the steps of your calculations and interpret your answer.

139_Figure1.png

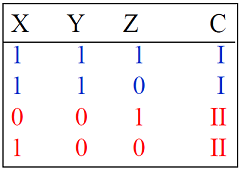
Figure 2: Data for Problem 3.b

Reference no: EM131035621

Questions Cloud

Recommend for the construction of this system : Which design strategy would you recommend for the construction of this system? Why?
Should the boom be fully retracted : The front wheels are free to roll. Do an equilibrium analysis to explain your answer.
Successively higher levels of debt : If a firm goes from zero debt to successively higher levels of debt, why would you expect its stock price to rise first, then hit a peak, and then begin to decline?
Has the researcher communicated clearly and fully : Did the article make an original contribution to the existing body of knowledge? Was the theoretical framework for the study adequate and appropriate?
Draw the box-plots for age and and fat : Draw the box-plots for age and %fat.  Interpret the distribution of the data and Normalize the two attributes based on z-score normalization
Dfs-files-directories and shares : From the first e-Activity, examine the key benefits afforded to an organization that utilizes Distributed File System (DFS) technologies.
Debt level that maximizes its stock price : Is the debt level that maximizes a firm's expected EPS the same as the debt level that maximizes its stock price? Explain.
Calculate profit margin and gross profit rate for company : Calculate the Profit Margin, and Gross profit rate for the company. Be sure to provide the formula you are using, show your calculations, and discuss your findings/results.
Analyzes the pros and cons of each : Your company has decided to open up a new comprehensive resort on a tropical island. Your manager (me) is working with corporate senior managers to determine how best to structure this new enterprise. analyzes the pros and cons of each, and describes..

Reviews

Write a Review

Engineering Mathematics Questions & Answers

  Ab-am-predictor-corrector method

Compare the results of i) to the exact solution and comment on the accuracy of the numerical algorithm and adopted step size.

  Suggest that the different foods

Of the 60 participants, 16 preferred cupcakes, 26 preferred candy bars, and 18 favored dried apricots. Do these scores suggest that the different foods are differentially preferred by people in general? (Use the .05 significance level.)

  Compute the test statistic

Compute the test statistic. The null hypothesis is to be tested at 95% confidence. Determine the critical value(s) for this test. What do you conclude?

  Floral arrangements for the upcoming holiday weekend

A florist is planning to make up floral arrangements for the upcoming holiday weekend. He has following supply of flowers in stock this Friday and he cannot get any more.

  Computer the standard purchase price for one gram of alpha

Computer the standard purchase price for one gram of Alpha SR40. Computer the standard quantity of Alpha SR40 (in grams) per capsule that passes final inspection.

  Report based on a hypothetical research study

Write a research report based on a hypothetical research study.  Conducting research and writing a report is common practice for many students and practitioners in any of the behavioral sciences fields.

  1nbspfor r euro ir show thatnbsp 2 weknow that the

1.nbspfor r euro ir show thatnbsp 2. weknow that the dirichlet seriesnbsp converges fornbspsigma gt 0.use this to

  What is the initial rate of cooling

What is the initial rate of cooling? How long does it take for the wafer to reach a temperature of 50°C? Comment on how the relative effects of convection and radiation vary with time during the cooling process.

  Implement the project within agreed procedures

Select a project and agree specifications and procedures and implement the project within agreed procedures and to specification.

  Solve differential equation using galerkin method

Solve differential equation of d 2 h /dx 2 =0 using the Galerkin method and considering 0 ≤ x ≤ 3 given that: h = 0 cm when x = 0 m and h = 10 cm when x = 3 m .

  Formulate linear programming problem to minimize total cost

Formulate a linear programming problem to minimize total cost for this transportation problem. Solve the linear programming formulation from part (a) by using either Excel or QM for Windows. Find and interpret the optimal solution and optimal value..

  Minimizing accident frequency and constitute progress

Determine the solution that will best achieve the company's goals in minimizing accident frequency and constitute progress toward satisfying OSHA compliance levels.  Interpret the solution results including the levels of goal achievement.

Free Assignment Quote

Assured A++ Grade

Get guaranteed satisfaction & time on delivery in every assignment order you paid with us! We ensure premium quality solution document along with free turntin report!

All rights reserved! Copyrights ©2019-2020 ExpertsMind IT Educational Pvt Ltd