Reference no: EM135340
Fishing in the public waterbodies of Victoria (rivers, creeks, lakes and reservoirs) is controlled by the Freshwater Fisheries Section (FFS) of the Department of Conservation and Natural Resources. To fish in the waterbodies, fishermen must buy a fishing licence. Licences cost $12 per month or $29 per year. Part of the income generated from selling fishing licences is used to stock the waterbodies with fish. Fish put into the waterbodies can be rainbow trout (RT), brown trout (BT) or redfin (RF). The State government has asked the FFS to determine if the stocking of waterbodies around the State is successful - are fishermen catching fish? A survey form was designed to record the details of fish being caught. These forms were provided to fisherman when they bought fishing licences each year. The forms were to be filled in each year and submitted to the FFS by post. The forms were very successful as fisherman like to boast about their catches. Unfortunately the FFS hadn't thought about how they were going to process the data on the survey forms. At the moment thousands of completed survey forms are stored in boxes in the main office of the FFS.
Your job is to design and implement a small information system which will help the FFS to process the survey forms quickly and accurately. An example of a completed survey form is below.
|
Department of Conservation and Natural Resources
Fishing Survey
Year: 2010
Angler Licence Number: H2318765 Angler Name: Pedro Catchmany
|
|
Fishing Sessions
|
Fish Caught
|
|
Date
|
Waterbody Name
|
Start
Time
|
End
Time
|
Species
|
Length
(mm)
|
Weight
(gm)
|
|
16/03/10
17/03/10
23/03/10
|
Lake Eppaloch
Lake Eppaloch
Campaspe River
|
0800
1715
0700
|
1100
2000
1200
|
RT RT RF
-
RF RF
|
450
475
350
-
485
395
|
850
880
600
-
550
490
|
The information system you design should allow for the efficient and accurate input, storage and maintenance of data on the survey forms.
Two reports are required:
1. A summary report for a particular year for each waterbody in the State in alphabetical order. For each waterbody the three species of fish are to be listed. For each species the total number caught; the average length and weight; and the average number of hours spent per fish caught are to be displayed. At the bottom of the report should be the same statistics for the whole State for the 3 species combined plus the total number of fishermen who recorded catching fish and the total number of hours spent fishing.
2. A detail report for a particular fisherman listing each year they have recorded catching fish.
Fishermen will pay $20 for this report. For each year, each waterbody fished at should be listed. For each waterbody the date, species, length and weight of each fish caught should be displayed. For each waterbody, for each year, a summary of the total number of fish caught, the total number of hours spent fishing, the average weight and length of fish and the average time spent per fish caught should be displayed. These statistics should be repeated for each year and for the whole report.
Assumptions
- Assume that a fisherman only fishes one session at one waterbody per day and a session does not go past midnight.
- Assume that a fisherman always records a waterbody name and fish species correctly on a survey form. (We know that fisherman always record fish length and weight correctly!!).
- Any other assumptions should be stated clearly.
Your Tasks:
PART I - SYSTEM DESIGN
1. Draw an Entity Relationship diagram for the system
2. Identify the table design for the database displaying all the fields/attributes. Ensure that all tables are in 3NF. You also need to identify the primary keys and foreign keys, where applicable.
Please follow the example below:
TABLE_NAME (Attribute1, Attribute2, Attribute3, RefAttribute),
where Attribute1 is the primary key and RefAttribute is the foreign key.
3. Draw paper design for both requested reports. The design should clearly identify the report header/footer, page header/footer, identifying fields, totals, etc. You should follow good output design principles.
PART II - SYSTEM IMPLEMENTATION
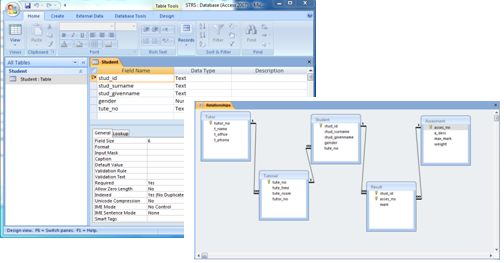
4. Use MS Access to create the tables for FFS systems. For the submission, you need to provide screen captures that clearly shows the tables and their attributes, as well as the relationship. Please see example below from your lab works.
NOTE: You need to populate the tables with at least 20 rows/tuples each. It will ensure your reports show some interesting data for the next task.
5. Use MS Access to create one report following the design in task 3. You just need to choose one report out of the two options. You need to use the data stored in your tables (not hard- coded!). For the submission, one generated report should be provided.