Reference no: EM131237605
Part A - Statistics for Decision Making Lab
Statistical Concepts:
- Data Simulation
- Confidence Intervals
- Normal Probabilities
Short Answer Writing Assignment
All answers should be complete sentences.
We need to find the confidence interval for the SLEEP variable. To do this, we need to find the mean and then find the maximum error. Then we can use a calculator to find the interval, (x - E, x + E).
First, find the mean. Under that column, in cell E37, type =AVERAGE(E2:E36). Under that in cell E38, type =STDEV(E2:E36). Now we can find the maximum error of the confidence interval. To find the maximum error, we use the "confidence" formula. In cell E39, type =CONFIDENCE.NORM(0.05,E38,35). The 0.05 is based on the confidence level of 95%, the E38 is the standard deviation, and 35 is the number in our sample. You then need to calculate the confidence interval by using a calculator to subtract the maximum error from the mean (x-E) and add it to the mean (x+E).
1. Give and interpret the 95% confidence interval for the hours of sleep a student gets.
Then, you can go down to cell E40 and type =CONFIDENCE.NORM(0.01,E38,35) to find the maximum error for a 99% confidence interval. Again, you would need to use a calculator to subtract this and add this to the mean to find the actual confidence interval.
2. Give and interpret the 99% confidence interval for the hours of sleep a student gets.
3. Compare the 95% and 99% confidence intervals for the hours of sleep a student gets. Explain the difference between these intervals and why this difference occurs.
In the lab, you found the mean and the standard deviation for the HEIGHT variable for both males and females. Use those values for follow these directions to calculate the numbers again.
(From lab: Calculate descriptive statistics for the variable Height by Gender. Click on Insert and then Pivot Table. Click in the top box and select all the data (including labels) from Height through Gender. Also click on "new worksheet" and then OK. On the right of the new sheet, click on Height and Gender, making sure that Gender is in the Rows box and Height is in the Values box. Click on the down arrow next to Height in the Values box and select Value Field Settings. In the pop up box, click Average then OK. Write these down. Then click on the down arrow next to Height in the Values box again and select Value Field Settings. In the pop up box, click on StdDevthen OK. Write these values down.)
You will also need the number of males and the number of females in the dataset. You can either use the same pivot table created above by selecting Count in the Value Field Settings, or you can actually count in the dataset.
Then in Excel (somewhere on the data file or in a blank worksheet), calculate the maximum error for the females and the maximum error for the males. To find the maximum error for the females, type =CONFIDENCE.T(0.05,stdev,#), using the females' height standard deviation for "stdev" in the formula and the number of females in your sample for the "#". Then you can use a calculator to add and subtract this maximum error from the average female height for the 95% confidence interval. Do this again with 0.01 as the alpha in the beginning of the formula to find the 99% confidence interval.
Find these same two intervals for the male data by using the same formula, but using the males' standard deviation for "stdev" and the number of males in your sample for the "#".
4. Give and interpret the 95% confidence intervals for males and females on the HEIGHT variable. Which is wider and why?
5. Give and interpret the 99% confidence intervals for males and females on the HEIGHT variable. Which is wider and why?
6. Find the mean and standard deviation of the DRIVE variable by using =AVERAGE(A2:A36) and =STDEV(A2:A36). Assuming that this variable is normally distributed, what percentage of data would you predict would be less than 40 miles? This would be based on the calculated probability. Use the formula =NORM.DIST(40, mean, stdev,TRUE). Now determine the percentage of data points in the dataset that fall within this range. To find the actual percentage in the dataset, sort the DRIVE variable and count how many of the data points are less than 40 out of the total 35 data points. That is the actual percentage. How does this compare with your prediction?
7. What percentage of data would you predict would be between 40 and 70 and what percentage would you predict would be more than 70 miles? Subtract the probabilities found through =NORM.DIST(70, mean, stdev, TRUE) and =NORM.DIST(40, mean, stdev, TRUE) for the "between" probability. To get the probability of over 70, use the same =NORM.DIST(70, mean, stdev, TRUE) and then subtract the result from 1 to get "more than". Now determine the percentage of data points in the dataset that fall within this range, using same strategy as above for counting data points in the data set. How do each of these compare with your prediction and why is there a difference?
Part B -
Q1. For the same sample statistics, which level of confidence would produce the widest confidence interval? Explain your reasoning. Choose the correct answer below.
90%, because as the level of confidence decreases, zc increases.
99%, because as the level of confidence increases, zc decreases.
99%, because as the level of confidence increases, zc increases.
90%, because as the level of confidence decreases, zc decreases.
Q2. Construct the confidence interval for the population mean μ.
c = 0.90, x- = 8.7, σ = 0.6, and n = 44
A 90% confidence interval for μ is.
Q3. Construct the confidence interval for the population mean μ.
c = 0.98, x- = 16.2, σ = 8.0, and n = 60
A 98% confidence interval for μ is.
Q4. Find the minimum sample size n needed to estimate μ for the given values of c, σ, and E.
c = 0.95, σ = 7.4, and E = 1
Assume that a preliminary sample has at least 30 members.
Q5. People were polled on how many books they read the previous year. How many subjects are needed to estimate the number of books read the previous year within one book with 99% confidence? Initial survey results indicate that σ = 10.1 books.
A 99% confidence level requires ________ subjects.
Q6. Construct the indicated confidence interval for the population mean μ using the t-distribution.
c = 0.99, x- = 12.4, s = 4.0, n = 8
The 99% confidence interval using a t-distribution is.
Q7. A doctor wants to estimate the HDL cholesterol of all 20- to 29-year-old females. How many subjects are needed to estimate the HDL cholesterol within 2 points with 99% confidence assuming σ = 14.7? Suppose the doctor would be content with 90% confidence. How does the decrease in confidence affect the sample size required?
A 99% confidence level requires _______ subjects.
A 90% confidence level requires ________ subjects.
How does the decrease in confidence affect the sample size required?
A. The lower the confidence level the larger the sample size.
B. The sample size is the same for all levels of confidence.
C. The lower the confidences level the smaller the sample size.
Q8. Construct the indicated confidence interval for the population mean μ using a t-distribution.
c = 0.90, x- = 113, s=10, n=16
The confidence interval is.
Q9. In a random sample of 17 people, the mean commute time to work was 34.6 minutes and the standard deviation was 7.3 minutes. Assume the population is normally distributed and use a t-distribution to construct a 90% confidence interval for the population mean μ. What is the margin of error of μ? Interpret the results.
The confidence interval for the population mean μ is.
The margin of error of μ is.
Interpret the results.
A. With 90% confidence, it can be said that the commute time is between the bounds of the confidence interval.
B. If a large sample of people are taken approximately 90% of them will have commute times between the bounds of the confidence interval.
C. With 90% confidence, it can be said that the population mean commute time is between the bounds of the confidence interval.
D. It can be said that 90% of people have a commute time between the bounds of the confidence interval.
Q10. A researcher wishes to estimate, with 99% confidence, the population proportion of adults who say chocolate is their favorite ice cream flavor. Her estimate must be accurate within 3% of the population proportion.
(a) No preliminary estimate is available. Find the minimum sample size needed.
(b) Find the minimum sample size needed, using a prior study that found that 36% of the respondents said their favorite flavor of ice cream is chocolate.
(c) Compare the results from parts (a) and (b).
(a) What is the minimum sample size needed assuming that no prior information is available?
(b) What is the minimum sample size needed using a prior study that found that 36% of the respondents said their favorite ice cream flavor is chocolate?
(c) How do the results from (a) and (b) compare?
A. Having an estimate of the population proportion reduces the minimum sample size needed.
B. Having an estimate of the population proportion raises the minimum sample size needed.
C. Having an estimate of the population proportion has no effect on the minimum sample size needed.
Q11. The table to the right shows the results of a survey in which 2582 adults from Country A, 1149 adults from Country B, and 1074 adults from Country C were asked if human activity contributes to global warming. Complete parts (a), (b), and (c).
|
Adults who say that human activity contributes to global warming
|
|
Country A
|
65%
|
|
Country B
|
90%
|
|
Country C
|
95%
|
(a) Construct a 90% confidence interval for the proportion of adults from Country A who say human activity contributes to global warming.
(b) Construct a 90% confidence interval for the proportion of adults from Country B who say human activity contributes to global warming.
(c) Construct a 90% confidence interval for the proportion of adults from Country C who say human activity contributes to global warming.
Q12. In a survey of 2748 adults, 1403 say they have started paying bills online in the last year.
Construct a 99% confidence interval for the population proportion. Interpret the results.
Interpret your results. Choose the correct answer below.
A. The endpoints of the given confidence interval show that adults pay bills online 99% of the time.
B. With 99% confidence, it can be said that the sample proportion of adults who say they have started paying bills online in the last year is between the endpoints of the given confidence interval.
C. With 99% confidence, it can be said that the population proportion of adults who say they have started paying bills online in the last year is between the endpoints of the given confidence interval.
Q13. In a survey of 8000 women, 5431 say they change their nail polish once a week. Construct a 95% confidence interval for the population proportion of women who change their nail polish once a week.
Q14. A researcher wishes to estimate, with 99% confidence, the population proportion of adults who are confident with their country's banking system. His estimate must be accurate within 3% of the population proportion.
(a) No preliminary estimate is available. Find the minimum sample size needed.
(b) Find the minimum sample size needed, using a prior study that found that 25% of the respondents said they are confident with their country's banking system.
(c) Compare the results from parts (a) and (b).
(a) What is the minimum sample size needed assuming that no prior information is available?
(b) What is the minimum sample size needed using a prior study that found that 25% of the respondents said they are confident with their country's banking system?
(c) How do the results from (a) and (b) compare?
A. Having an estimate of the population proportion reduces the minimum sample size needed.
B. Having an estimate of the population proportion raises the minimum sample size needed.
C. Having an estimate of the population proportion has no effect on the minimum sample size needed.
Q15. The table shows the results of a survey in which separate samples of 400 adults each from the East, South, Midwest, and West were asked if traffic congestion is a serious problem in their community. Complete parts (a) and (b).
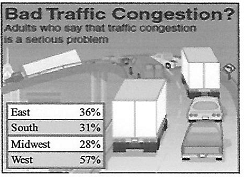
(a) Construct a 95% confidence interval for the proportion of adults from the East who say traffic congestion is a serious problem.
(b) Construct a 95% confidence interval for the proportion of adults from the South who say traffic congestion is a serious problem.