Reference no: EM131218253
Assignment : Computer Aided Power System Design and Analysis
1 Aims of Assignment
- To gain a thorough understanding of Load Flow analysis, balanced and unbalanced fault level analysis, power and voltage control in addition to the impacts of reactive power compensation, distributed generation and smart grid solutions.
- To enhance the student learning process, by relating the theory and analytical procedures to computer aided techniques for system analysis and problems solving.
2 Learning Outcomes
The student will be able to:
- Design simple power networks incorporating typical high voltage and low voltage components (e.g. overhead lines, transformers, cables, distributed generators, etc.) and analyse their performance.
- Describe the principles of smart grid solutions (e.g. the use of reactive power compensators and active network control) and analyse simple power networks incorporating these solutions.
- Become competent in using commercially available software packages for system design and analysis of modern power engineering and appreciate the difference with theory.
- Become competent in power systems analysis incorporating a variety of components.
3 Assignment Requirements
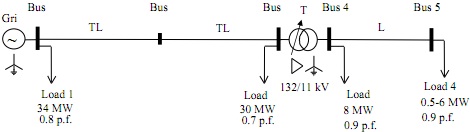
(a) To construct, using ERACS software package, the example network shown in Figure (1).
For help and technical support, refer to the User Guide and Technical Manual, available online in ERACS Help, Manuals menu. You may also do Tutorial 1: Creating a network and Tutorial 2: Power system example, both available in Help, Tutorials menu.
You are encouraged to keep a log book to record your progress.
(b) This is individual work and each student is required to write a report (a text maximum of 1500 words, excluding diagrams, contents, references etc.) to include computer print- outs and the different particulars described in sections 4 and 5. A statement to indicate your conclusions, assumptions made and the usefulness of the assignment must also be given.
It is expected that the overall standard of presentation will be high and untidy or disorganized reports will be penalized. The quality of the network model is also important. While you may work on the network model with others, the report must be your own work; you must not copy from others. Any reference material you use must be acknowledged.
(c) To Submit the report to the Faculty of Engineering and Environment office (Ellison Building, Room B201), no later than 4.30 p. m. Friday 20th November 2015. You are allowed to hand the work in prior to the submission date. Keep a proof of submission, to demonstrate that you have submitted the Assignment.
A CD or any other storage mean (which includes a copy of the network computer model and an electronic copy of the report) must be submitted with the actual report. All should be clearly labelled with student's name, module number and module name. Alternatively, you may email a folder (that includes all files) to [email protected]. Note that a hard copy of the report has to be submitted to the Faculty office as in (c) above.
Academic Integrity Statement: You must adhere to the university regulations on academic conduct. Formal inquiry proceedings will be instigated if there is any suspicion of plagiarism or any other form of misconduct in your work. Refer to the University's Assessment Regulations for Northumbria Awards if you are unclear as to the meaning of these terms. The latest copy is available on the University website.
Procedure
Before you run ERACS package, create ‘Library' and ‘Work' folders in your U drive. The former will hold the library files that you create and the latter will hold the network files. Before you logout, make sure to copy (backup) all your files (saved in ‘Library' and ‘Work' folders) to a memory stick.
Run the ERACS package from the Start menu and choose User Name as student and password as student.
The first time you use the ERACS, you need to create a new database by selecting New Database from the Database menu. Note that you need to be in ‘Work' folder (U drive).
From the File menu select New Network and set Network Name and Data State Name. You need to assign project library from Libraries menu. Select a name for Project Library 1 and save it into the ‘Library' folder in the U drive. You may also choose (optional) Project Library 2 as the Reference Library, by selecting the ERA_Reference_Library from the subdirectory C:\Programme Files\ERACS\ Libraries.
Follow the instructions given in the user manual to construct the network given. Notice that you need to create each element of the network and save it in Project Library 1 (in the U drive) by selecting Library and New for each element. Then, Select the element from the Library Key list.
Choosing a 100 MVA study base, construct the network given.
The system positive, negative and zero sequence reactances (X1, X2 and X0 , respectively) are given in p.u. on 100 MVA base as follows:
TL1 and TL2: X1 = X2 = 0.06 and X0 = 0.2
Cable L3: R1 = R2 = 0.52 and R0 = 0.4 X1 = X2 = 0.25 and X0 = 0.35 Tr : 20 MVA X1 = X2 = X0 = 0.15 X/R = 15
Assume that the Grid fault infeed is 2000 MVA and X/R = 10. Ignore the effects of resistance in the transmission system.
For transformer, select "Neutral Earthing Data" with zero neutral earthing resistance and reactance. Select a suitable tap changer with target voltage at bus 4 (Lower target voltage = 0.99 and upper target voltage = 1.01). Set the initial tap of the transformer to zero.
Make any necessary approximations and assumptions required to simplify the design and state any assumption made.
Load Flow Analysis
Carry out the load flow analysis for two loading conditions at the far end of the 11 kV feeder: 6.0 MW, representing peak demand and 0.5 MW to represent off peak demand.
From Calculate menu choose Load Flow and perform the load flow analysis. During running of the program, warnings may be displayed, as some values of the network components are not entered. Accept all the default values suggested.
From the Results menu choose Select Data / Results and Load flow, then:
(i) Busbar: Voltage (p.u.) , Voltage (kV) , Voltage angle ( o ) and Three Phase Fault level (MVA).
(ii) Line Real power (MW) and Reactive power (MVAr).
(iii) For Cable, Transformer and Shunt, select the same as in (ii).
From Results menu, choose Show Results to display the selected results and record them (from File menu choose Print and then Diagram). You may need to adjust the layout of the results before you print; refer to the User Guide.
Comment on the results obtained with regard to the flow of active and reactive power, voltage profiles and fault levels at different parts of the system for the two loading conditions.
Unbalanced fault calculations
Use 6 MW load at the far end of the 11 kV feeder.
Carry out unbalanced fault calculations, as outlined below:
(i) From the calculate menu, choose Fault and set a Study Name. Select a solid single phase to earth fault on Bus 4 and run the program. Monitor and print the fault current and the voltages (magnitude and angle) of the three phases.
(ii) Repeat section (4.10 i) for a solid phase to phase fault on Bus 4.
For a solid earth fault on phase R conductor at Bus 4, calculate (using analytical procedure):
(i) the current fed into the fault (in p.u. and in kA) and
(ii) the voltages of the healthy phases at Bus 4.
Ignore the effects of the resistance in the system and assume that the system is at no load before the fault occurs.
Compare these results with those obtained in section 4.10 and comment on the difference.
Effect of installing a VAr compensator at the middle of the line
As there is no model of a VAr compensator in ERACS, a synchronous motor model (SM) is used to represent a VAr compensator. Connect this model to Busbar 2 (with 50 MVA 1.0 p.u. voltage rating, very small assigned output power (e.g. 0.1 MW) and 20 MVAr assigned "supply" reactive power. Use the impedance data X1 = 0.2 p.u., X2 = 0.12 p.u. and X0 = 0.03 p.u. Run Load Flow analysis, show and print selected results, as in section (4.8). Compare with previous results and comment. Also comment on the effect of the VAr compensator on the maximum power that can be transmitted through the line.
Distributed Generation
Remove the synchronous motor and restore the original network with 6 MW load at the far end of the feeder.
(i) Connect 4 × 2 MW distributed generators (employing synchronous machines) at the far end of the 11 kV feeder (Busbar 5). Accept the default values for the generator and assume an Inertia constant H = 2 kWs/kVA. Select a Group Assigned Power = 6 MW and assume that the generators are operating at unity power factor. Run the load flow analysis, compare the results with those obtained in section 4.8 and comment.
(ii) Reduce the load at the end of the 11 kV feeder to 0.5 MW, run the load flow analysis, compare these results with those obtained in section 4.13(i) and comment.
Active network control
To implement active voltage control, change the target voltage for the tap changer of the distribution transformer to Busbar 5. Run the load flow analysis, compare the results with those obtained in section 4.13 and comment.
Every time you finish using the ERACS package, save your files and remember to copy all files (‘Library' and ‘Work' folders) to a memory stick.
5 Discussion and Conclusions
It is usual practice in power systems to represent a transmission or distribution system by its Thevenin equivalent circuit which comprises a voltage source and the line series impedance. Assuming that the voltage at the receiving-end of a line is the reference phasor, i.e. V1 = V1∠0o, and that at the sending-end is V2 = V2∠δo:
(i) Derive an expression for the active and reactive power flow through the line. Comment on the main factors that largely determine the flow of active and reactive power in the line.
(ii) Derive an expression for the voltage drop across the line and show how this voltage drop could be minimized by using reactive power (VAr) compensation. Comment on the effectiveness of VAr compensators when employed to control the voltage in Low Voltage distribution networks.
Comment on the effects of distributed generation (mainly from renewable energy resources) on the voltage profile, fault level and power flow in distribution networks. You may refer to the expressions derived in sec. 5.1.
Summarize your conclusions and the usefulness of the assignment. Include a very brief description of the means that are usually used by electricity suppliers to control voltage levels, active and reactive power flow in power networks (give one method for each). Also comment on the use of smart grid solutions to facilitate the integration of distributed generation.