Reference no: EM13184005
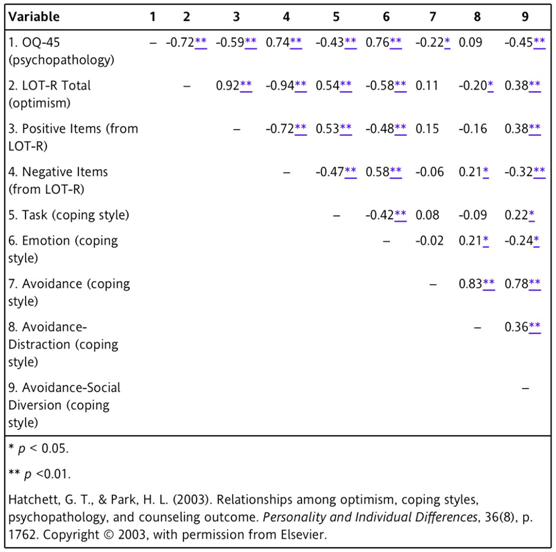
In Table 2 in p. 175, Hatchett and Park (2004) presented the correlations among optimism (LOT-R Total and Positive Items); pessimism (Negative Items); psychopathology (OQ-45); and coping styles (Task, Emotion, Avoidance, Avoidance-Distraction, and Avoidance-Social Diversion). Table 2 is a mirror-image table with the variables numbered and labeled on the y-axis and the numbers of the variables on the x-axis. The blank spaces in the table are where the variable is correlated with itself and would be a +1.00 correlation.
1. What is the r value listed for the relationship between variables 4 and 9?
2. Describe the correlation r = -0.32** using words. Is this a statistically significant correlation? Provide a rationale for your answer.
3. Calculate the percentage of variance explained for r = 0.53. Is this correlation clinically important? Provide a rationale for your answer.
4. According to Table 2, r = 0.15 is listed as the correlation between which two items? Describe this relationship. What is the effect size for this relationship, and what size sample would be needed to detect this relationship in future studies?
5. Calculate the percentage of variance explained for r = 0.15. Describe the clinical importance of this relationship.
6. Which two variables in Table 2, have the weakest correlation, or r value? Which relationship is the closest to this r value? Provide a rationale for your answer.
7. Is the correlation between LOT-R Total scores and Avoidance-Distraction coping style statistically significant? Is this relationship relevant to practice? Provide rationales for your answers.
8. Is the correlation between variables 9 and 4 significant? Is this correlation relevant to practice? Provide a rationale for your answer.
9. Consider two values, r = 0.08 and r = -0.58. Describe them in relationship to each other. Describe the clinical importance of both r values.
10. Examine the Pearson r values for LOT-R Total, which measured Optimism with the Task and Emotion Coping Styles. What do these results indicate? How might you use this information in your practice?
BONUS QUESTION
One of the study goals was to examine the relationship between optimism and psychopathology. Using the data in Table 2, formulate an opinion regarding the overall correlation between optimism and psychopathology. Provide a rationale for your answer.
|
Describe the large disparity in the numerical results pf
: Explain the large disparity in the numerical results pf Part (a). Discuss the advantages and disadvantages of the three energy sources.
|
|
Compare the impact of the tax cut on income
: Two identical countries, Alpha and Beta, can be described by the IS-LM model in the short run. The governments of both countries cut taxes by the same amount. The Central Bank of Alpha follows a policy of holding a constant money supply. The Centr..
|
|
Explain the molarity of the naoh solution
: In the standardization of NaOH, 38.76 mL of NaOH was required for 0.8169 g potassium acid phthalate. Estimate the accuracy we should expect in the molarity of the NaOH solution assuming the weighing error is ±0.1 mg
|
|
Relationship between the secular and sacred
: What was the relationship between the secular and the sacred in Europe between 15th and 17th centuries?
|
|
Calculate the percentage of variance explained
: Calculate the percentage of variance explained for r = 0.53. Is this correlation clinically important and what is the r value listed for the relationship between variables 4 and 9?
|
|
Who wins the price war
: Consider a firm selling two products, A and B, that substitute for each other. Suppose that an entrant introduces a product that is identical to product A. What factors do you think will affect (a) whether a price is initiated, and (b) who wins t..
|
|
Explain the preparation of a l solution
: You have available at your lab bench a 0.1 M solution of TRIS in its protonated form, 0.1 M solutions of HCL and NaOH, and ample distilled water. Describe the preparation of a 1 L solution of 0.2 M TRIS buffer, pH 7.8
|
|
Make contact with the ball above shoulder level
: What you would do if you make contact with the ball above shoulder level. What you would do if you make contact with the ball below shoulder level. Skill used to finish a point
|
|
Under what conditions might the plant not be built
: a paper recycling facility is proposed ofr a town. because of the bleaches and other chemicals used in paper recycling, there are concerns about the air and water pollution from the plant. a team of economists has studied the facility. the total b..
|