Flow Charts:
A flow chart is a block diagram that outlines, step by step, the computational procedures necessary for accomplishing the processing requirements of a computer program. It is a planning document or ‘blueprint' of a program's logic that specifies a processing plan.
A flow chart, therefore, is a diagrammatic representation of the logic to be incorporated in the computer program. It helps the programmer organize the sequence of steps that the computer requires for solving a problem. A flow chart is used for describing the process that is being studied or for planning the different stages involved in a project.
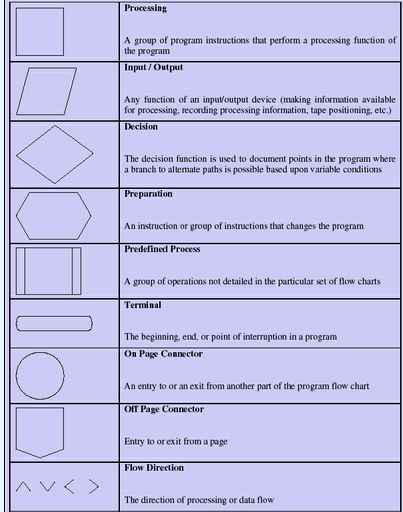
Program flow charts use symbols to identify each step in the process. These flow-charting symbols are now established standards, and most companies require programmers to use these symbols in their conventional design while preparing program flow charts. The use of a common set of symbols helps other programmers understand the flow charts. These flow-charting symbols enable easy understanding of the program or the process and help in finding out any flaws in it. Since all software developers are familiar with these symbols, even new employees can easily understand the program flow charts.
The working of a program flow chart can be explained with the help of a problem - preparing a car for being driven to work. The logic starts with the oval symbol at the top marked "start" and continues until a "stop" symbol is encountered. Three basic processes common to all programs occur in this program flow chart:
Data - input or output
The input or output actions in a flow chart are depicted by parallelogram-shaped input/output symbols.
Decision making
Questions are represented by diamond-shaped decision symbols. They indicate decision points in a flow chart. They are diamond-shaped and present two decision alternatives, Yes or No. This is called branching.
Processing
Processing refers to any action performed on the input data. For instance, arithmetic computation is shown by the rectangular processing symbol in the flow chart.
Email based Information technology and system assignment help - homework help at Expertsmind
Are you searching Computer science expert for help with Flow Charts questions? Flow Charts topic is not easier to learn without external help? We at www.expertsmind.com offer finest service of Information technolgy and system assignment help and Information technology homework help. Live tutors are available for 24x7 hours helping students in their Flow Charts related problems. We provide step by step Flow Charts question's answers with 100% plagiarism free content. We prepare quality content and notes for Flow Charts topic under Information technology theory and study material. These are avail for subscribed users and they can get advantages anytime.
Why Expertsmind for assignment help
- Higher degree holder and experienced experts network
- Punctuality and responsibility of work
- Quality solution with 100% plagiarism free answers
- Time on Delivery
- Privacy of information and details
- Excellence in solving Information Technolgoy and system queries in excels and word format.
- Best tutoring assistance 24x7 hours