What is the role of capacitors in the ac analysis

Assignment Help Other Engineering
Reference no: EM131311177

Lab: AC Models

Introduction:

The lab is based on the AC models of a transistors. After the transistor has been biased with a Q-point near the middle of the load line, we can couple a small AC voltage into the base. This creates an AC collector voltage which is larger than the base voltage and hence this arrangement results in an amplifier with a voltage gain.

Please review the following videos before getting started with this lab:

1. Watch the video: "Video 3: Fundamentals of breadboard"
https://content.grantham.edu/at/EE212/1-20-2015/week2/Fundamental_of_Breadboard.mp4

2. Watch the video: "Video 4: Basic electrical components"
https://content.grantham.edu/at/EE212/1-20-2015/week2/Basic_Electrical_Components.mp4

3. Watch the video: "Video 5: Simple resistive circuit with NI myDAQ"
https://content.grantham.edu/at/EE212/1-20-2015/week2/Simple_Resistive_Circuit_with_NI_myDAQ.mp4

Materials and Equipment:

• Hardware Parts (In the Toolbox):

o An NPN transistor: 2N3904
o Five resistors: Two - 1kΩ, 2kΩ, 10kΩ and 40kΩ
o Three Capacitors: 1μF, 100μF
o Jumper wires

Equipment:

• Software equipment:

o Multisim
o Virtual Instruments (in Multisim)
o Agilent Multimeter

• Hardware Equipment:

o Breadboard
o NI myDAQ Instrument device
o Screw Driver
o Screw Terminal connector
o USB Cable
o Multimeter with probes
o Function Generator, Oscilloscope, Multimeter from NI ELVISmxIntrument Launcher

Procedure:

This lab has to be implemented in hardware (using NI myDAQ) as well as Software (Multisim)

Part A:

7. Analyze the circuit or the amplifier shown in Figure 1. Determine the voltages VB, VE, VC, VBE and VCE. Using the beta value of 100, determine the gain of the amplifier (AV). (Include 20% tolerances for resistors and capacitors).

8. Construct the circuit shown in Figure 1 on the breadboard using the hardware parts.

9. Using the jumper wires, screw driver and screw terminal connector, connect the board to NI MyDAQ Instrument Device.

10. Using the function generator in NI ELVISmx Instrument Launcher, provide the voltage (Vin). Use channel AO0 pin on the NI myDAQ Instrument Device to provide this voltage. Make sure the frequency is 1 KHz frequency.

11. Using +15V pin out on the Instrument Device provide the supply voltage VCC.

12. Perform the DC Analysis by disconnecting the capacitors and measuring VB, VE, VC, IB, IE and IC.

13. Place the capacitors back and using pin AI0 on the NI myDAQ Instrument Device, measure the required voltages: VB, VE, VC VBE, VCE.

14. Measure the currents: IC and IE using the Multimeter.

15. Use AI1 on the NI myDAQ Instrument Device to measure the load voltage VRL. Record the measurements and compare them with the calculated values in step 1.

16. Using the input voltage Vin, base voltage VB and load voltage VRL, determine the gain of the amplifier (AV).
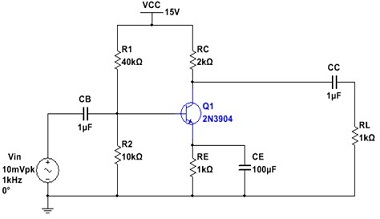
907_Circuit.jpg
Figure 1

Part B:

17. Download the "Lab 6 troubleshooting" file and perform analysis for the circuits to locate the fault embedded in the circuit.
https://content.grantham.edu/at/EE212/1-20-2015/week6/Lab_6b_troubleshooting.ms12

18. Step by step measure the key point's value with Agilent multimeter. Carefully analyze each measured value to locate the fault within the circuits. Fix the fault and with the corrected fault in the newly circuit, measure and record the new values.

Review questions:

19. Compare a calculated and measured values. Discuss whether the values are the same of different. If they are different, provide the reasoning.

20. Does the DC analysis confirm your calculations?

21. What is the gain of the amplifier? Does the gain obtained from analysis match the measured gain? If not, what is the problem and how would you fix it?

22. What is the role of capacitors in the AC analysis?

23. Did you find any clipping of the collector current? If so, how did you adjust the circuit to avoid clipping?

Deliverables:

24. DC and AC analysis of the circuit and all the calculations including gain of the amplifier from step 1.

25. Place your student ID card on the breadboard and take a picture of the circuit board and pin out on the NI myDAQ Instrument Device.

26. Take screenshots of the measurements obtained from function generator and Oscilloscope and Multimeter on the NI ELVISmx Instrument Launcher on your screen.

27. Screenshots of the measurements from DC analysis (without the capacitors). Screenshots of the measurements from AC analysis (with the capacitors). Screenshots of the input voltage Vin, base voltage VB and load voltage VRL.

28. Screenshots of collector voltage (Vc) (if any clipping).

29. Tabulate the data from analysis and measurements to confirm the gain of the amplifier.

Lab Report:

• Use the Lab report template found in the "Tools and Template" link in the navigation center.

• Include all the deliverables.

• Include all the screenshots of the measurements from circuit design on the breadboard using NI myDAQ Instrument Device and measurements from MI ELVISmx Instrument Launcher.

Reference no: EM131311177

Questions Cloud

Environmental economics-an introduction : Environmental Economics:  An Introduction Answer three of the five questions as completely as you can.  Your responses should be a minimum of 250 words (about one page) for each question.
Show contents of the bucket and the queue in each case : Assume that the packets are all the same size and need the same amount of time for processing. If at time zero the bucket is empty, show the contents of the bucket and the queue in each of the following cases and interpret the result.
Velocity of money to decrease : In the early 1990s, banks began offering check-writing privileges on money market mutual funds. This caused ( the velocity of M1 to increase, the velocity of money to decrease, the velocity of M2 to increase)
How the router can use the leaky bucket algorithm : Assume a router receives packets of size 400 bits every 100 ms, which means with the data rate of 4 kbps. Show how we can change the output data rate to less than 1 kbps by using a leaky bucket algorithm.
What is the role of capacitors in the ac analysis : What is the gain of the amplifier? Does the gain obtained from analysis match the measured gain? If not, what is the problem and how would you fix it? What is the role of capacitors in the AC analysis?
Calculate output and profits : A perfectly competitive firm has variable costs given by VC=q^2 and fixed costs of FC=$1. Calculate output and profits if the price were P=$4. Explain whether this firm should shutdown if price falls to P=$1. Provide a labelled diagram for MC, ATC..
How many gallons of liquid are left in the bucket : In a leaky bucket used to control liquid flow, how many gallons of liquid are left in the bucket if the output rate is 5 gal/min, there is an input burst of 100 gal/min for 12 s, and there is no input for 48 s?
Why do we need 16 different keys : Figure 31.9 in the text shows that DES creates 16 different 48-bit keys, one for each round. Why do we need 16 different keys? Why can't we use the same key in each round?
Experience as a result of their last name : What are some privileges that people might experience as a result of their last name?

Reviews

Write a Review

Other Engineering Questions & Answers

  Draw the diagram of the current source and three loads

There upon, we can switch each load on or off without affecting the power delivered to the other loads. How would we connect the loads and switches if the source is an ideal independent current source?

  Utilized for the configuration of the event counter

1. What commands are utilized for the configuration of the Event Counter? How does each affect the operation of the Event Counter? 2. What signal was observed at the output of DACA? What is the signal frequency of the DACA wave? What is ..

  Prove that two open-collector ttl inverters

Using the actual output transistors of two open-collector TTL gates, show (by means of a truth table) that when connected together to an external resistor and Var, the wired connection produces an AND function.

  Determine the volume of water lost

Determine the volume of water lost (in m3) through evaporation during a year from Lake Okeechobee (Florida). Lake Okeechobee has a surface area of 190,000-ha located in a region where the annual rainfall is 1500 mm. The increase in the depth of th..

  Program to simulate a drink-dispensing machine

Simulate a drink-dispensing machine and to evaluate its operation using the development system boards in Embedded Systems laboratory. The inputs to the drink-dispensing machine are simulated by 5 pushbutton switches on PORTD.

  The seminal vesicles

The seminal vesicles: A) are located in the abdominal cavity. B) are in the scrotum.

  Design and draw a circuit using the cascade system

Design and draw a circuit using the cascade system to operate two cylinders (A and B) which, on the operation of a start valve, produces the sequence A - B + B - A+. The cylinders should park in the positions B - A + when the start switch is in th..

  The project management institute

Include a title page and 3-5 references.  Only one reference may be from the internet (not Wikipedia).  The other references must be from the Grantham University online library.

  Write a paper about wave propagation in metamaterials

Please choose one topic from given topics and write around 13 pages about that topic - You are welcome to work on a topic of your own choice.

  Construct the series and parallel inductive reactive circuit

Discuss why it is often stated that inductors and capacitors are "dual" elements. Include similarities and differences that must be taken into account when performing calculations with each element and how these two elements are capable of exchang..

  The angle the line makes with the x-axis

After reviewing the materials of this week, please answer the following question. Is there a relationship between the sign (positive or negative) of the slope of a line and the angle the line makes with the x-axis?

  What was the soil resilient modulus of the subgrade

The reliability was 70%, overall standard deviation was 0.5, ΔPSI was 2.0 (with a TSI of 2.5), and all drainage coefficients were 1.0. What was the soil resilient modulus of the subgrade used in design?

Free Assignment Quote

Assured A++ Grade

Get guaranteed satisfaction & time on delivery in every assignment order you paid with us! We ensure premium quality solution document along with free turntin report!

All rights reserved! Copyrights ©2019-2020 ExpertsMind IT Educational Pvt Ltd