Reference no: EM13909236
Assignment- Quantitative Methods
QUESTION 1- The accompanying graph represents the amount spent (in$'000) by randomly selected customers at a retail store over a 12-month period.
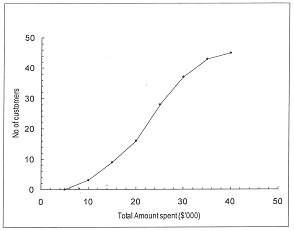
Use the information provided in the graph to calculate, for the period in question, each of the following quantities.
1.1 The mean amount spent.
1.2 The modal amount spent.
1.3 The coefficient of variation. Comment on the value obtained.
QUESTION 2-
2.1 A candidate is shortlisted for interviews for three posts. The numbers of candidates (in total) for the three posts are 3, 4 and 2 respectively. Calculate the probability that the candidate is successful for at least one post.
2.2 Researchers at a School of Medicine in the US have determined that children under 2 years old who sleep with the lights on have a 36% chance of becoming myopic before they are 16 years of age. It was also determined that children under 2 years old who sleep in darkness have a 21% probability of becoming myopic before they are 16 years old. A survey Indicates that 28% of children under 2 years old sleep with some light on. What is the probability that a child under 16 is myopic?
2.3 An auditor is preparing for a physical count of inventory as a means of verifying its value. Items counted are reconciled with a list prepared by the storeroom supervisor. In one particular firm the auditor selected 10 items and found that the probability of exactly 5 items that could not be reconciled without reviewing invoices was 0.026424 and the probability of exactly 6 items that could not be reconciled without reviewing invoices was 0.005505. Calculate the probability that no fewer than 3 items could not be reconciled without reviewing invoices. Show details of your calculations.
QUESTION 3- The plant manager of a company that manufactures office equipment is attempting to determine the process that will be used to assemble a new ergonomic chair. Two methods (A and B) are under consideration. These methods differ by the order in which the separate operations are performed. To help decide which method should be used, an experiment was carried out. Fifteen randomly-selected workers each assembled the chair using method A, and 15 randomly-selected workers each assembled the chair using method B. The assembly times (in minutes) are given in the table below.
| Method A |
6.6 |
5.7 |
56 |
6.4 |
6.3 |
6.0 |
7.0 |
5.9 |
6.4 |
7.5 |
7.0 |
5.2 |
| Method B |
5.7 |
6.5 |
5.3 |
6.7 |
5.9 |
6.1 |
5.5 |
6.6 |
5.1 |
4.9 |
6.6 |
6.9 |
Conduct a complete test, at the 5% level of significance, to determine whether there is a statistically significant difference between the two methods.
QUESTION 4- The data given in the accompanying table represents the quarterly sales figures (in$'000) over the years 2010 to 2013 of a leading retail store specializing in ladies fashion garments.
| Year |
Jan-Mar |
Apr-Jun |
Jul-Sep |
Oct-Dec |
| 2010 |
-
|
530 |
563 |
600 |
| 2011 |
625 |
550 |
580 |
619 |
| 2012 |
650 |
570 |
692 |
635 |
| 2013 |
670 |
590 |
622 |
-
|
Determine seasonally-adjusted trend estimates of the sales figures for the first two quarters of 2014. Show full details of your calculations.
QUESTION 5- A large manufacturing company has had a very difficult time for the last couple of years in the market it operates.
Its Board of Directors must now decide whether or not a new factory should be built and the size of the factory.
The MD of the company suggests that the company should conduct a market survey to gauge how the market will react to the product that the company intends launching.
The research department has provided the following information:
P(favourable selling conditions) = 0.55
P(favourable market research/favourable selling conditions) = 0.75
P(unfavourable market research/unfavourable selling conditions) = 0.80
It is estimated that a large factory under favourable selling conditions will realize a profit of $300000, but will suffer a loss of $200000 under unfavourable selling conditions. In addition, it is estimated that a small factorywill realizea profit of $200000 if selling conditions are favourable, but will suffer a loss of $120000 under unfavourable selling conditions. The cost of conducting market research will amount to $10000, which is not taken into account when calculating profit and loss.
With the aid of a labeled decision tree, determine the optimal course of action the company should take. Show details of your calculations.
|
Describe three types of market share
: There are three types of market share. Describe each one. In your opinion, which one would be more beneficial for a health care organization to use to measure their performance in market share? Provide detail with examples.
|
|
Homeostasis of body temperature
: How does intensity of exercise affect the homeostasis of body temperature? 1. Create a Data Table prior to the recording data of this investigation.
|
|
Find the steady-state probabilities in simplest form
: Show that the chain is reversible and find the steady-state probabilities {πi} in simplest form. Find a condition on {P0j; j ≥ 0} and {Pj0; j ≥ 0} that is sufficient to ensure that all states are positive recurrent.
|
|
Describe marketing research and its role in an organization
: Please describe marketing research and its role in an organization. A.C. Nielsen is a leading research company.
|
|
What is the probability that a child under 16 is myopic
: Researchers at a School of Medicine in the US have determined that children under 2 years old who sleep with the lights on have a 36% chance of becoming myopic before they are 16 years of age. It was also determined that children under 2 years old..
|
|
Corporate and marketing strategies to reach target market
: Product portfolio analysis, including product life cycle and SBU Analysis investment strategy and a business level strategy for each SBU (Porter's or Miles and Snow strategies)based on the SBU analysis.
|
|
What proportion of time in each of the states
: Let pj denote the proportion of time that {Xn, n ≥ 1} is in state j. If pj > 0 for all j, what proportion of time is {Yn, n ≥ 0} in each of the states 0, 1, ... , m?
|
|
The following costs result from the production and sale
: The following costs result from the production and sale of 12,000 CD sets manufactured by Gilmore Company for the year ended December 31, 2013. The CD sets sell for $ 18 each. The company has a 25% income tax rate.
|
|
Concentration inside a red blood cell
: Red blood cell membranes are completely impermeable to sodium, potassium and chloride ions, however they are permeable to both water and urea. The concentration inside a red blood cell is 300mOsm and consists predominantly of sodium and potassium ..
|