Success of employment applications

Assignment Help Business Economics
Reference no: EM13316157

The Success of Employment Applications in Ohio during the Gentleman's Recession

On April 18, 1906, a 7.9 earthquake hit San Francisco, California. The death total rom the earthquake and associated fires and mud slides is estimated to have been 3,000. As many as 300,000 people, out of a population of 400,000, were made homeless. Property damage amounted to $400 million, $250 million of which was covered by insurance.

With such an enormous claim upon the insurance industry, insurance companies and the entire financial system were subjected to enormous stress. The following year, the Panic of 1907 broke out.

Stock prices tumbled. Banks were closed. And, an industrial recession got underway. Fortunately, J.P. Morgan and others stepped in to support stock prices; and, banks issued $100 million of scrip (or, emergency money). And, the recession was shortYlived. Indeed, for a time, this recession was called The Gentlemen's Recession, as it was said to have mostly affected investors and did not much affect those in the working class.

1473_Success of Employment Applications.png

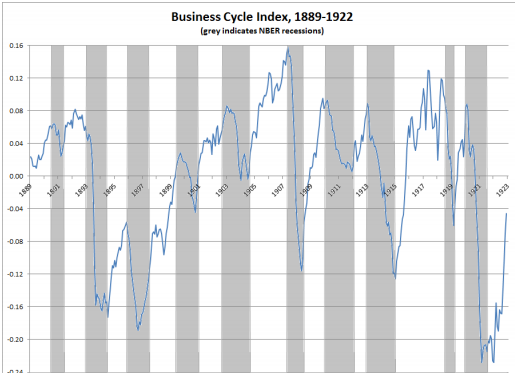
The chart above shows an index of the business cycle during the period.

It is relatively easy to see the sharp fall in the index during the recession that followed the Panic of 1907. It is also relatively easy to see the sharp recovery from this recession.

During the period, the State of Ohio operated employment offices in five cities. From their reports, monthly time series can be constructed for job applications, job listings and job placements, for men and for women, for each of the five cities, from Sept. 1890 to Oct. 1912.

These employment offices focused on inexperienced and unskilled workers, and difficult to place individuals.

1736_Success of Employment Applications1.png

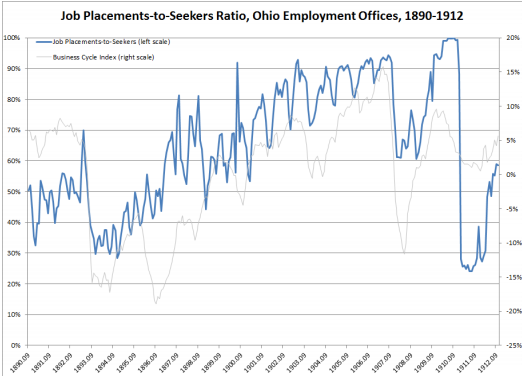
The above chart displays the ratio of job placements to seekers, for the total of men and women in all five cities, juxtaposed against the business cycle indicators. Two things should stand out:

First, there is a strong upward trend the ratio through 1910. After that, there is a sharp decline. This decline, it turns out, is due to an administrative change involving the differentiation of registered from not registered job applicants. Accordingly, the data following 1910 are not directly comparable to the data through 1910.

Second, through 1910, there appears to be a weak, positive correlation between the ratio and the business cycle index. In particular, the ratio dips during the recession that followed the Panic of 1893 and it dipped again during the recession that followed the Panic of 1907.

In this assignment, you are to:

• Use the data in the accompanying spreadsheet, for the period Sept. 1890 to Dec. 1910, to estimate a multiple regression in which the dependent variable is the ratio of job placements to job seekers for your city and demographic group (which you can obtain in the Gradebook), and the independent variables are (1) time and (2) the business cycle index.

• Use the regression output to comment on (1) whether the ratio is affected by the business cycle;

(2) whether the ratio is particularly sensitive to the business cycle (affected by more than 1YtoY1); and, (3) whether the ratio fell by at least as much as would be predicted following the Panic of 1907.

Verified Expert

Reference no: EM13316157

Questions Cloud

Determine the speed of each disk after the collision : Two shuffleboard disks of equal mass, one orange and the other green, are involved in a perfectly elastic glancing collision. Determine the speed of each disk after the collision
Calculate the moment of f about the y axis from a to b : A 100 lb force vector F is aligned from A to B. Point A is located at the coordinates (2, 2, 2) and point B at (4,5,6). Calculate the moment of F about the y axis.
Determine the maximum theoretical speed that may be achieved : Determine the maximum theoretical speed that may be achieved over a distance of 60 m by a car starting from rest, knowing that the coefficient of static friction is 0.80 between the tires and the pavement
Determine length of mercury column and water column : A right circular cylinder has radius of 1cm and contains Hg ( d= 13.596 kg/l), Determine length of mercury column and length of water column
Success of employment applications : Success of Employment Applications in Ohio during the Gentleman's Recession and chart displays the ratio of job placements to seekers, for the total of men and women in all five cities, juxtaposed against the business cycle indicators.
Determine the velocities of the two people : a 68.0 kg person throws a 0.0490-kg snowball forward with a ground of 29.0 m/s. What are the velocities of the two people after the snowball is exchanged
How does it compare financially what kind of interaction : Explain what a “virtual house call” is. How does this method compare with the traditional doctor's office visit in terms of patient-doctor relationship?
Calculate concentration of oxygen in water in equilibrium : Calculate the concentration of oxygen in the water in equilibrium (in mg/L) with the atmosphere near La Paz, Bolivia (3650 m), at 20 degrees Celcius.
Calculate the approximate alkalinity of water containing ion : Calculate the approximate alkalinity (in mg/L as CaCO3) of a water containing 120 mg/L of bicarbonate ion and 15 mg/L of carbonate ion.

Reviews

Write a Review

Business Economics Questions & Answers

  Economics assignment

This document contains various important questions and their appropriate answers in the subject field of Economics.

  Demand and supply curves

Economics is the study of the principles governing the allocation of scarce means among competing ends when the objective of the allocation is to maximize the attainment of the ends.

  Long-run perfectly competitive equilibrium for the firm

Evaluate Government intervene and correct this situation?(a) Explain the concept of a concentration ratio. A rise in the price of magarine Explain the impact of external costs and external benefits on resource allocation long-run perfectly c..

  Supply and demand diagrams

Explain each of the following using supply and demand diagrams,  With the use of a graph, explain how these two programs affect cigarette consumption and the price of cigarettes.

  Case study: fisher-price toys

The case study of the Fisher-Price Toys, Inc., a popular case in basic economics and management from the prestigious Harvard Business School.

  Draw the production possibility curve

Draw the production possibility curve and a. Define consumer surplus and producer surplus.

  Tax revenue

The Australian government administers two programs that affect the market for cigarettes

  Maximize total welfare

How many tickets to sell to maximize total welfare.

  Difference between the cv and the ev

The change in consumer surplus (?CS) is not "theoretically" justifiable like the CV and EV but it continues to be the most widely used measure of consumer welfare change. Explain how this can be reconciled

  Depict von neumann-morgenstern utility index u in a diagram

Depict the von Neumann-Morgenstern utility index u in a diagram

  What is the market solution

What is the market solution (market price and quantity) and What is the total surplus of the society under the market solution

  Calculate gross national product and net national product

Calculate gross national product and net national product

Free Assignment Quote

Assured A++ Grade

Get guaranteed satisfaction & time on delivery in every assignment order you paid with us! We ensure premium quality solution document along with free turntin report!

All rights reserved! Copyrights ©2019-2020 ExpertsMind IT Educational Pvt Ltd