Reference no: EM131003925
PART A:
Question 1:
(a) Fred is a Milko and a bit of an amateur statistician. He has just written out his weekly bills for 24 of his account customers. The number of litres of milk consumed by each household that runs an account with him follows:
25 29 42 22 7 15 18 24
5 12 16 14 23 18 10 17
12 34 28 12 31 23 11 17
(i) Construct a stem and leaf plot of Fred's data. Comment on the shape of the plot.
(ii) Calculate the mean and standard deviation of the data. What percentage of this data is within one standard deviation of the mean?
(iii) From your stem and leaf plot calculate the five figure summary for the data set and then draw a box plot of the data.
(iv) Fred, after all this work, remembers that the corner store he delivers to used 117 litres of milk last week, and they do pay by account. Should this data point be included in the data set or left out?
Justify your decision.
(v) Fred decides to calculate a confidence interval estimate of the average number of litres of milk consumed by all 250 households that he delivers to. He is worried that the 24 account customers may not be a good enough sample to use. What advice would you give to Fred?
(b) The published returns on deposits for two managed investment companies for the past 18 years are:
Mean Std. Dev.
Company A 9.6 5.3
Company B 9.3 0.7
(i) Calculate the coefficient of variance for these companies.
(ii) The average return is acceptable from both companies and you wish to invest for only a short period, as risk free, as possible. Which company would you choose to invest with, and why?
Question 2:
(a) A trucking company finds that on average 30 percent of its shipments arrive late. Eight shipments are scheduled to arrive that evening.
(i) What is the probability that three shipments will arrive late?
(ii) What is the probability that at least three will arrive late?
(iii) If 30 shipments are scheduled to arrive the following day, what is the probability that more than half of these will arrive late?
(b) Dell Publishing has 750 different book titles classified by type and cost as follows.
Cost
Type $10 $15 $20
Fiction 100 80 30
Biography 120 100 90
Historical 40 170 20
(i) Find the probability that a book selected at random is fiction or costs $10.
(ii) Find the probability that a book selected at random is historical and costs either $10 or $15.
(iii) Given that a book selected is fiction, what is the probability that the book costs more than $10?
(c) Weekly costs for a printing business in Bathurst have averaged $410, with a standard deviation of $90 over the past few years. The manager has told the owner of the business that he should be able to keep costs below $300 this week. If costs are normally distributed, use an appropriate calculation to determine whether the manager is likely to be able to achieve this goal.
Question 3:
(a) You are the manager of the Tourist Information Centre in a large National Park. It is hypothesized that 40% of all visitors to the park also visit the Tourist Information Centre. From a random sample of 50 visitors to the park, you find that only 15 visited the Tourist Information Centre.
(i) Use a 5% level of significance to test whether the actual proportion of park visitors that go to the Tourist Information Centre is less than the hypothesized 40%
(ii) Use the sample estimate to find the sample size required, to determine the true proportion of park visitors that also visit the Tourist Information Centre to within 5%, with 95% confidence.
(b) A photography counter in a department store offers a one hour developing and printing service. 36 customers were selected at random and the film processing times for each customer were recorded. The mean processing time for these 36 customers was found to be 1 hour 15 minutes (1.25 hours) with a standard deviation of 20 minutes (0.333 hours)
(i) Estimate with 95% confidence the true mean processing time.
(ii) Hence or otherwise, ascertain whether the companies claim of a one hour service is likely to be correct. (Use a 5 % level of significance)
Question 4:
(a) The owner of a large chain of ice cream stores would like to study the effect of atmospheric temperature on sales during the summer months. A random sample of 21 days is selected and data relating daily high temperature (oC) and ice cream sales ($000s) is collected. MS Excel is then used to generate the following output and graphs.
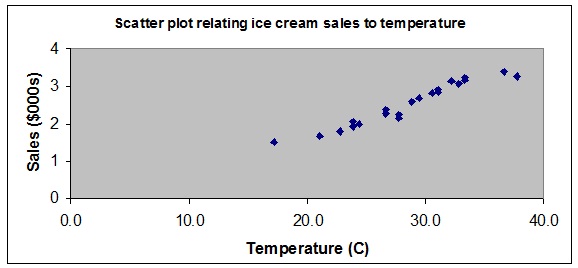
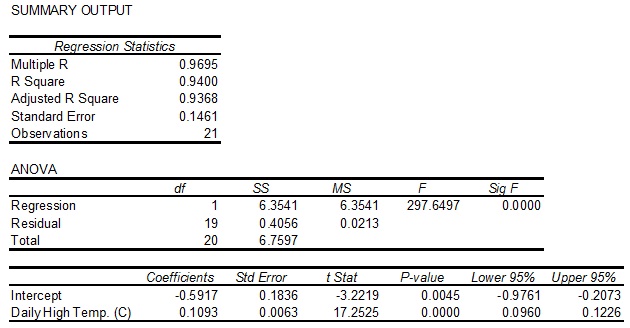
Use the output provided to answer the following questions.
(i) Interpret the scatterplot.
(ii) What is the equation of the regression line relating ice cream sales to daily high temperature?
(iii) Interpret the meaning of the slope coefficient in this problem.
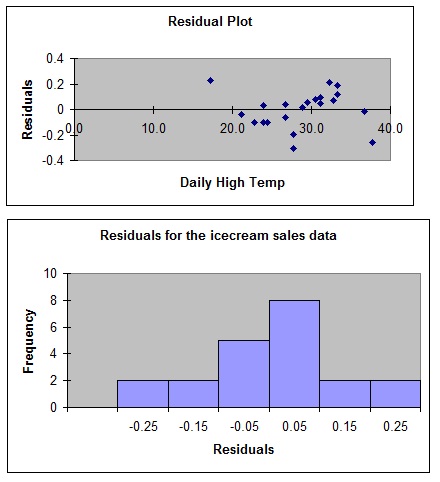
(iv) One of the assumptions of regression analysis is normality. For the ice cream data, does it appear that this assumption has been violated? Explain.
(v) At the 0.05 level, is there evidence of a linear relationship between temperature and sales?
(vi) Predict the sales per store on a day in which the temperature is 28oC.
(b) A major amusement park had the following number of visitors each quarter from 1992 to 1996:
Number of visitors (thousands)
Quarter 1 Quarter 2 Quarter 3 Quarter 4
1992 155 231 270 105
1993 182 255 315 294
1994 160 250 280 297
1995 210 310 365 335
1996 225 325 384 386
(i) Find the four-quarter centred moving averages for the second quarter.
(ii) Use your answers from (i) above to calculate the seasonal index for the second quarter (correct to 3 decimal places).
(iii) The seasonal index for each of the other three quarters is given below.
Quarter 1 Quarter 2 Quarter 3 Quarter 4
0.741 1.227 0.967
Do we need to make an adjustment to these indexes?
If an adjustment is required, what would be the adjusted seasonal index for the second quarter?
PART B:
The following information should be used with questions 1 to 3
The number of people living in a house was sampled from a district in Sydney.
The results are displayed in the frequency table below.
Number of people Frequency
0 1
1 3
2 10
3 6
4 15
5 5
1. From this sample, the shape of the distribution of the number of people living in houses in this area is thought to be:
A. unimodal with a positive skew.
B. unimodal and nearly symmetric.
C. unimodal with a negative skew.
D. bimodal with a negative skew.
E. bimodal with a positive skew.
2. The median number of people living in these 40 houses is:
A. 2.5
B. 3.15
C. 3.5
D. 4.0
E. 15
3. One household that reported having 5 people living there was later found to have 15 people in residence. This new information would cause:
A. no change to the mean, the standard deviation and the median.
B. no change to the mean and the standard deviation but the median to rise.
C. no change to the mean and median but the standard deviation would rise.
D. no change to the median but the mean and the standard deviation would rise.
E. the mean, the standard deviation and the median all to rise.
4. A recent poll of voters in the local Federal seat shows that the Liberal Party is polling 32%, the National Party is polling 12%, the Labor Party is polling 44%, One Nation is polling 9% and all others combined account for the remaining 3% of votes. The best sort of graph to display the relative positions of the parties is a:
A. box plot.
B. histogram.
C. line graph.
D. ogive.
E. pie chart.
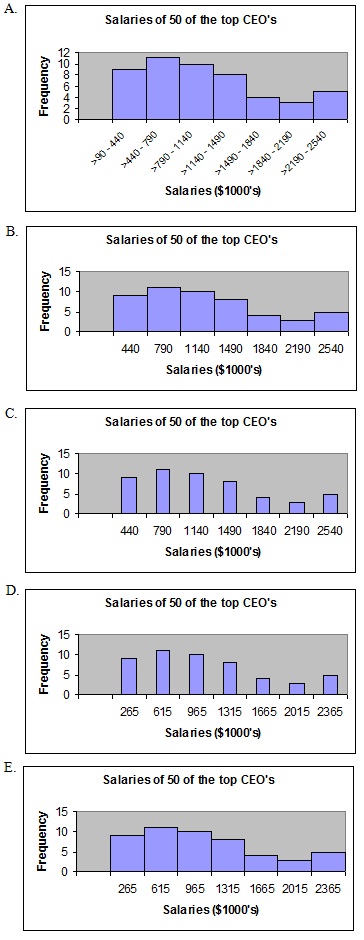
5. The salaries in thousands of dollars of 50 CEO's from the top corporations is given in the following frequency table.
Salary (in $1,000's) Frequency
>90 up to and including 440 9
>440 up to and including 790 11
>790 up to and including 1140 10
>1140 up to and including 1490 8
>1490 up to and including 1840 4
>1840 up to and including 2190 3
>2190 up to and including 2540 5
Excel has been used to construct a histogram to represent the frequency distribution above. The most correct histogram would be
6. Aeroplanes arrive at Chicago's O'Hare airport at the average rate of 5.5 per minute. Air traffic controllers can safely handle a maximum of seven planes per minute. What is the probability that airport safety is jeopardised? Planes arrive randomly and independently.
A. 0.809
B. 0.894
C. 0.085
D. 0.191
E. 0.106
7. Given that Z is the standard normal random variable, find P(0.3 < Z < 2.4)
A. 0.3739
B. 0.6079
C. 0.6261
D. 0.4798
E. 0.3614
8. Over the past 20 years Fred has driven to work in Sydney every day. The quickest he has made the trip is 60 minutes. The longest it has ever taken him is 110 minutes. If driving times are uniformly distributed what is the probability he can make the trip in 1.5 hours?
A. 0.4
B. 0.20
C. 0
D. 0.6
E. There is insufficient information to answer this question.
9. Given that Z is the standard normal random variable, find A when P(Z < A) = 0.1
A. 0.25
B. -0.25
C. 1.28
D. -1.28
E. -0.04
10. Consider the process of tossing a fair coin 6 times. Which of the following sequences of tosses is more likely to occur?
A. THTHHT
B. HHHTTT
C. HHHHHH
D. TTHHTH
E. They are all equally likely.
11. In dealing with normal distributions, the t distribution is appropriate when
A. the sample is biased and the true population standard deviation is not known
B. the sample is large and the true population standard deviation is known
C. the sample is small and the true population standard deviation is not known
D. The sample is small and the true population standard deviation is known
E A. and C. above are both true.
12. A sample of size 16 is drawn from a population which is normally distributed with a mean of 50 and standard deviation of 40. The standard error of the sample mean is
A. 2.5
B. 10
C. 6.3
D. 1.58
E. not able to be calculated from the above information
13. Which of the following statements is false?
A. The standard error of the mean is always smaller than the standard deviation of the population.
B. The standard error of the mean is dependent on sample size.
C. Larger sample sizes give better estimates of population parameters.
D. The distribution of repeated rolls of a single dice (observing the number showing on the face of the dice) would be normal.
E. A large number of repeated samples of size 50, taken from the same population will be normally distributed, regardless of the shape of the parent population
14. If a hypothesis test returned a p-value of 0.5, we should
A. accept the null hypothesis.
B. reject the null hypothesis
C. not reject the null hypothesis.
D. reduce the α level until significance is achieved.
E. use another test statistic.
15. Which of the following statements describes an interval estimator?
A. The mean annual rainfall for Sydney is 1220 mm.
B. The average annual income in Australia is $39000.
C. The standard deviation of our news poll is 3 %.
D. The train is always 6 minutes late.
E. None of the above statements.
16. The scatterplot below shows the relationship between the number of customers and weekly sales in thousands of dollars for a sample of 20 package delivery stores.
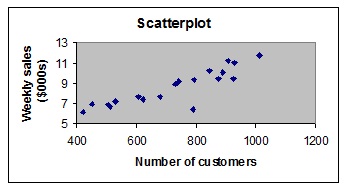
The correlation coefficient, which measures the strength of the linear relationship between weekly sales and number of customers would be approximately
A. 0.88
B. -0.88
C. 0.32
D. -0.32
E. 0.61
17. A study found that there is a strong positive correlation between a person's height and annual income. The most reasonable explanation is
A. employers like to pay more to tall people and there is a linear relationship between an employee's height and income.
B. employers like to pay more to tall people but there may not be a linear relationship between an employee's height and income.
C. the positive correlation is due to measurement error.
D. the observed association between the height and annual income is due to common response.
E. tall people have the highest incomes.
18. The high level of sales that department stores experience during the Christmas period is an example of what component(s) of a time series?
A. trend
B. cyclical
C. seasonal
D. irregular
E. seasonal and trend
19. Use the following time series to answer the question below.
Year 1 2 3 4 5
Sales 12 14 19 23 18
The exponentially smoothed value for year 3, using a smoothing constant of 0.6 will be
A. 14.3
B. 15.7
C. 16.4
D. 16.7
E. 13.2
20. If the seasonal index for January sales is 1.25, this means that
A. the January sales are below the average monthly sales.
B. the January sales are 0.25% above the average monthly sales.
C. the January sales are 1.25% above the average monthly sales.
D. the January sales are 25% below the average monthly sales.
E. the January sales are 25% above the average monthly sales.