Reference no: EM13680853
Question 1:
For the following questions we will be interested in the variable "State Of Peace".
(a) Create a new variable which is the ratio between primary school completion rate for boys and girls.
(b) Create a graphic showing the relationship between primary school completion ratio and State of Peace.
(c) Describe the relationship between primary school completion ratio and State of Peace.
(d) Can you say that having more girls complete school will create a more peaceful society?
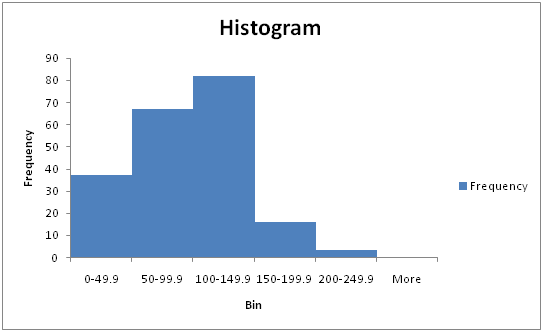
Examine the number of cell phones per 100 people.
Mean = 94.4586
Median = 99.0438
Standard Deviation = 44.3779
Minimum = 2.5728
Q1 = 63.7016
Q2 = 99.0438
Q3 = 122.0457
Maximum = 243.4980
Question 2:
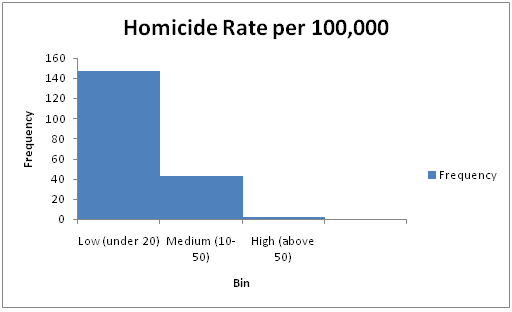
Make the Homicide Rate per 100,000 categorical variable. The categories will be Low (under 20), Medium (20-50), and High (above 50).
|
Bin
|
Frequency
|
|
Low (under 20)
|
147
|
|
Medium (10-50)
|
43
|
|
High (above 50)
|
2
|
Question 3:
Analyzing the relationship between GDP per Capita and State of Peace. Data points where any of the 2 variables are unavailable will be removed. GDP per capita will be on the vertical column, and state of peace will be on the horizontal column.
|
|
|
|
State of Peace
|
|
|
|
|
|
Very High
|
High
|
Medium
|
Low
|
Very Low
|
|
|
Very High
|
9
|
1
|
1
|
0
|
0
|
|
|
High
|
15
|
17
|
5
|
5
|
0
|
|
GDP per Capita
|
Medium
|
0
|
12
|
14
|
2
|
1
|
|
|
Low
|
4
|
13
|
25
|
6
|
1
|
|
|
Very Low
|
0
|
2
|
8
|
6
|
1
|
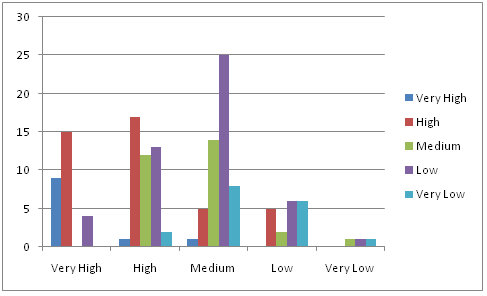
Analyze the relationship between the 2 variables with a Chi-Square Test for Independence.
Chi-Square = 72.8013
P = 0
The Chi-Square test demonstrates that the 2 variables are not independent.This table shows, very clearly, that more peaceful countries tend to be wealthier, and less-peaceful countries tend to be poorer. This implies that war impoverishes nations.
Question 4:
Analyze the relationship between the percent of babies born by professional staff and infant mortality per 1000 live births. Data points where any of the variables are unavailable will be removed. The percent of babies born by professional staff will be on the x-axis, while the infant mortality per 1000 live births will be on the y-axis.
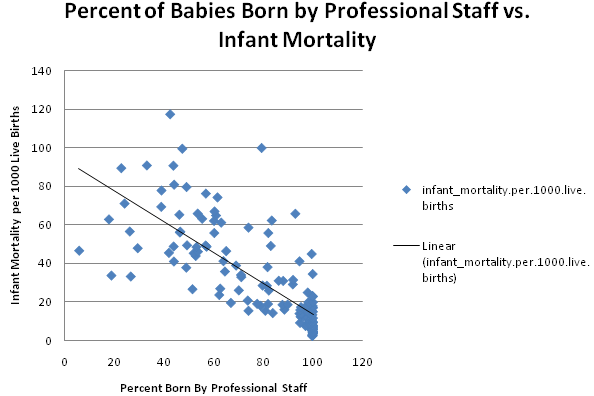
As one can clearly see in the scatterplot, the more babies are born to professional staff, the lower the infant mortality. The correlation coefficient is -0.7713, indicating a strong correlation between the 2 variables. The coefficient of determination is 0.5949, indicating that 59.49% of the variation in infant mortality can be explained by the variation in the percent of babies born by professional staff. The regression equation is y = 67.3474-0.5456x. This implies that the infant mortality per 1000 live births is expected to be 67.3474 if nobody was both by professional staff. Infant mortality decreases by about 0.5456 per 1000 live births for every 1% increase in the percent of babies born by professional staff. Infant mortality is expected to be 12.7874 per 1000 live births if everyone is born by professional staff.
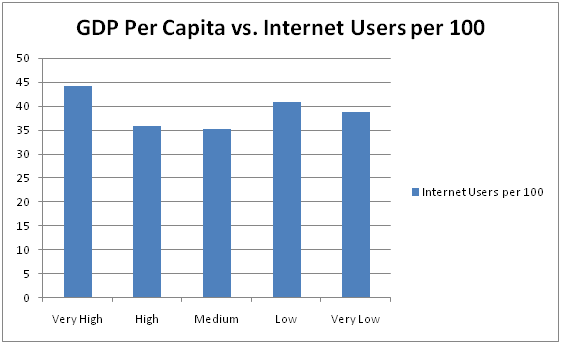
Question 5:
Examine the relationship between GDP per capita and the number of internet users per 100 people. Data points where any of the 2 variables are missing will be removed. One would think that the higher the GDP per capita, the higher the internet usage per capita. Apparently, this is not the case. It seems that low-income and very-low-income countries have higher average GDP per capita's than medium-income and high-income countries. According to an ANOVA test, the F-value is 0.5053 and the P-value is 0.7319. Since P>0.05, it seems that internet usage is independent of GDP per capita. This implies that rich countries and poor countries have approximately equal internet access, which is a good thing.
|
GDP per Capita
|
Mean
|
SD
|
|
Very High
|
44.21665
|
25.20059
|
|
High
|
35.87134
|
28.58251
|
|
Medium
|
35.13683
|
29.95423
|
|
Low
|
40.91742
|
28.94977
|
|
Very Low
|
38.66123
|
29.11551
|
Question 6:
|
State of Peace
|
Mean
|
SD
|
|
Very High
|
0.995
|
0.01915
|
|
High
|
0.992147
|
0.058782
|
|
Medium
|
1.042463
|
0.102411
|
|
Low
|
1.08571
|
0.17888
|
|
Very Low
|
1.46427
|
0.529132
|
The boys/girls primary school completion ratio tends to be higher in less peaceful societies and lower in more peaceful societies. This implies that, in peaceful societies, women have the same opportunities as men; but in violent societies, they do not. I would say that women having more opportunities is the result of, not the cause of, the peacefulness of a society.
An ANOVA test to determine if the population means for the 5 categories differ. F = 15.9148, P = 0. This means that the differences among the categories cannot be attributed to chance.
Question 7:
Create a scatterplot between the amount of arms imports in USD and the homicide rate per 100,000. All data points where at least one of the variables is unavailable will be removed. The amount of arms imports in USD will be on the x-axis and the homicide rate per 100,000 will be on the y-axis.
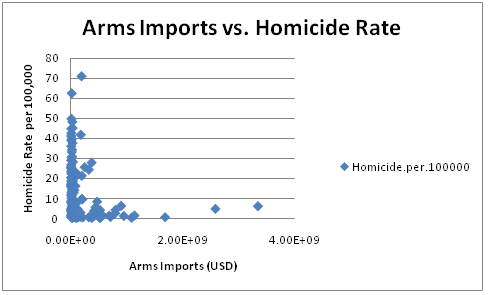
The amount of arms imported and the homicide rate do not seem to be related. The correlation coefficient between the 2 variables is -0.2009. This is the opposite of what one would expect. One would expect that nations that import more weapons have higher murder rate, but they do not.