Reference no: EM13960278
QUESTION ONE:
The ID3 algorithm constructs a decision tree based on an estimate of the "best" attribute for the current set of data at that level in the tree.
(a) Outline the ID3 algorithm for constructing a decision tree. Assume that the initial set of examples is represented as the set S and that you have a supplied function that determines the next "best" attribute for splitting.
(b) The change in entropy is one approach to selecting the "best" attribute when deciding how to split the current node for a decision tree. Define a measure of entropy for the classification problem shown in part (c), and explain how it is used to select the "best" attribute for splitting.
(c) The ID3 algorithm is now applied to the following table of data, where the examples el ..e8 are based on three attributes (atl ..at3) and classified as either positive (+) or negative (-) examples.
|
Example
|
at1
|
at2
|
at3
|
Classification
|
|
el
|
a
|
x
|
n
|
+
|
|
e2
|
b
|
x
|
n
|
+
|
|
e3
|
b
|
y
|
n
|
-
|
|
e4
|
a
|
y
|
m
|
-
|
|
e5
|
a
|
y
|
n
|
+
|
|
e6
|
a
|
x
|
p
|
+
|
|
e7
|
c
|
z
|
p
|
-
|
|
e8
|
c
|
z
|
n
|
+
|
Assume that you are starting the construction of the decision tree, and that the "best" attribute for the first split in the tree has been determined to be at2.
Draw the decision tree after this initial split, and include at each node of the tree the new subset of examples that need to be split, or if the node is homogeneous then include the final classification for this node.
QUESTION TWO:
Assume that a data set describing N numeric features (F1..FN) for a set of countries has been supplied. Each feature describes a global performance measure, such as %employment, Gross Domestic Product (GDP), etc. The country data can be represented as a table, as shown below in TABLE 1.
TABLE 1 - Countries and Features
|
Country Name
|
F1 |
F2
|
... |
FN |
|
Australia
|
0.9 |
10.4
|
|
7.3 |
|
New Zealand
|
0.3 |
40.0
|
|
2.0 |
|
...
|
... |
...
|
|
.. |

Countries N Features describing each country
(a) Explain how a Self-Organising Map (SOM) could be used to determine whether there is a relationship between particular features and various countries. Include with your explanation a description of the architecture of the SOM, how the resulting SOM would be labelled, and how you could interpret the output from the SOM.
You are now given additional data that describes characteristics of each country that are believed to be important driving factors in the determination of Fi..FN. These additional factors are shown below in TABLE 2.
TABLE 2 - Country Characteristics
|
Country Name
|
Tax Rate (TR)
|
Education Level (EL)
|
Pop. Per km2 (PPK)
|
Cost of Living/ earned (CL)
|
|
Australia
|
42%
|
2.4
|
5.6
|
0.6
|
|
New Zealand
|
38%
|
2.5
|
2.3
|
0.45
|
|
....
|
...
|
...
|
...
|
...
|
(b) Describe the architecture for an artificial neural network (ANN) that could be trained to predict the N features of TABLE 1 given the country characteristics of TABLE 2. Include a diagram of your ANN, and any data transformations that you would perform on the initial data. Assume a single hidden layer with 5 nodes. Include an example of how you would use your ANN once it was trained.
(c) You now want to explore different architectures of neural networks to the previous problem, and in particular you want to test whether having a network with feedback connections between the output and the hidden/input layers result in better performance. Since the back propagation algorithm will no longer work you decide to evolve the weights for the neural network. Define:
1) the representation of an individual that could be used to evolve a neural network;
2) an example of crossover and mutation for your representation;
3) the fitness function for the problem; and
4) the selection method used when evolving the population.
QUESTION THREE:
You are tasked with creating a fuzzy rule-based system for Environment New Zealand, who are interested in being able to predict the current fire danger given a set of conditions. The model operates in two stages: the first stage predicts the amount of available biomass for burning (i.e. the amount of dry vegetation on the ground), and then uses this in combination with temperature to predict fire danger. The details are:
1. Available biomass (low, moderate, high) is inferred from vegetation density (which is measured from aerial photographs as vegetation mass in kg per km2) and days since last rain, where the available biomass increases as the days since last rain increases.
2. Fire danger (low, moderate, high) is based on available biomass and temperature (higher temperature increases the fire danger). Examples of the relationships between these variables are shown in the table below.
|
Vegetation Density
|
Days
since last rain
|
Available Biomass
|
Temperature
|
Fire Danger
|
|
500
|
5
|
Moderate
|
16 |
Low
|
|
2000
|
10
|
High
|
22
|
High
|
|
500
|
1
|
Low
|
25
|
Moderate
|
(a) Define the fuzzy membership functions (MF) and fuzzy rules for the system. You do not need to include all of the rules for the system, however include at least 2 rules for available biomass and two rules for fire danger. Include with your answer a comment regarding the form of the scale (x-axis) used with the available biomass membership function.
(b) Based on your example MFs and rules, show the steps involved in producing a valuation for the first entry in the table above. Include a description of fuzzification, rule application and defuzzification for your example.
(c) Briefly describe how fuzzy membership functions and fuzzy rules could be automatically constructed from a large set of data such as that given in the table above.
QUESTION FOUR:
Each of the following questions is worth 5 marks. Please write approximately 10-15 lines per question. Use diagrams where appropriate.
(a) Describe how the learning rate and momentum parameters of the back propagation algorithm affect an artificial neural network's traversal of an error surface. Use a diagram to support your explanation.
(b) The "Red Queen" is one concept associated with co-evolutionary system dynamics. Describe the "Red Queen" scenario in relation to a predator-prey system, and describe how a co-evolutionary system can be used to learn to play a zero-sum game (such as tic-tac-toe).
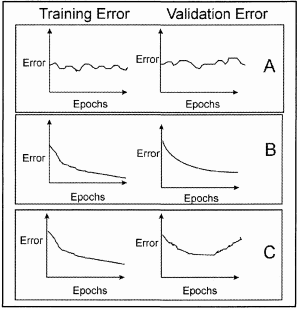
(c) The figure below shows three different training runs (labelled A, B & C) when applying backpropagation to your ANN. Comment briefly on the likely quality of the three resulting ANN's based on these errors.
(d) Assume that you have an evolutionary algorithm using roulette-wheel selection, crossover and no mutation. Explain why in general as the evolution proceeds the selection pressure of the population alters over time. What is the selection pressure once the population has converged?
QUESTION FIVE:
This question considers the role of sensitivity analysis approaches for supervised learning models.
(a) Explain the role of sensitivity analysis in terms of understanding the properties of a model. In particular, address the issue of how variation in model inputs can be assessed, and why this is important.
(b) Explain how sensitivity analysis can be performed for a linear regression model and highlight the assumptions used to hold certain variables constant during the analysis. Give one example where these assumptions may be invalid.
(c) In relation to the SOM-MLR model described in lectures, describe how the prototype vectors created for the SOM can be used to support sensitivity analysis for the local linear models associated with each prototype. In addition, explain why this approach overcomes some of the issues you have highlighted in part (b).
QUESTION SIX:
(a) The K nearest neighbour (KNN) algorithm uses a distance metric to order the training data in relation to a given test example. Given a problem with data in the form (x1,.....,xn,Y), where are independent variables, and y is the dependent variable for prediction, describe and explain an approach to weighting the k nearest neighbours so that nearer neighbours are more important when producing the final predicted y value for a test example.
(b) Outline the k-means clustering algorithm for a set of data defined as vectors xi. Include a diagram to support your algorithm description.
(c) Explain why the k-means clustering algorithm does not guarantee finding the optimal cluster locations for any given application of the algorithm. Given this non-optimal clustering, what does this imply in terms of how k-means should be used in practice to ensure a good clustering?
QUESTION SEVEN:
Assume that you are going to construct a local modelling tool with the following characteristics: the local "states" will be defined using a clustering tool that describes the membership of each instance (example) for each cluster (state) as a probability; the local model for each cluster will be a weighted linear regression; and the tool will be built using the Java classes from the machine learning tool Weka. The following class definition and associated methods are given (but empty):
public class LocalProbRegression extends Classifier 1
public LocalProbRegression(int numclusters) {
}
public void buildClassifier(Instances data) throws Exception
1
public double classifyInstance(Instance instance) throws Exception
{
Assume that the interface for the supplied probabilistic clustering tool ProbClusterer is as follow:
Constructor:
ProbClusterer(int num_cluster_centres)
Initially defines the clusterer with <num_cluster centres>.
Methods:
void buildClusterer(Instances data)
Build the cluster based on the training data <data>.
double[] distributionForInstance(Instance instance)
Given an instance, returns the array of membership probabilities, one for each cluster.
Give a pseudo-code description for one possible solution to the probabilistic local modelling tool by expanding each of the methods shown above for the LocalProbRegression class. Marks will be allocated according to how well each of the following concepts is addressed:
(a) how the clusters are represented;
(b) how the probabilities are used to construct the local models;
(c) the class structure that represents each cluster and local model; and
(d) how a prediction is constructed for a given instance.