Reference no: EM131083099
Section A - Multiple Choice Questions
1. Determine the probability distribution's missing value. The probability that a tutor will see 0, 1, 2, 3, 4, 5, 6, 7 or 8 students on a given day
|
x
|
0 |
1 |
2 |
3 |
4 |
5
|
6 |
7 |
8 |
|
P(x)
|
0.02 |
0.02 |
0.06 |
0.06 |
0.08 |
?
|
0.30 |
0.16 |
0.08 |
A. 0.11 B. 0.30 C. 0.02 D. 0.22
2. When the following hypotheses are being tested at a level of significance of α
H0: μ ≥ 500
Hα: μ < 500
the null hypothesis will be rejected if the p-value is
A. ≤ α
B. > α
C. > α/2
D. ≤ 1 - α/2
3. If a hypothesis is rejected at the 5% level of significance, it
A. will always be rejected at the 1% level
B. will always be accepted at the 1% level
C. will never be tested at the 1% level
D. may be rejected or not rejected at the 1% level
4. A machine is designed to fill toothpaste tubes with 5.8 ounces of toothpaste. The manufacturer does not want any under filling or overfilling. The correct hypotheses to be tested are
A. H0: μ ≠ 5.8 Ha: μ = 5.8
B. H0: μ = 5.8 Ha: μ ≠ 5.8
C. H0: μ > 5.8 Ha: μ ≤ 5.8
D. H0: μ ≥ 5.8 Ha: μ < 5.8
5. The average life expectancy of tires produced by the Bradley Tire Company has been 70,000 miles. Management believes that due to a new production process, the life expectancy of their tires has increased. In order to test the validity of their belief, the correct set of hypotheses is
A. H0: μ < 70,000 Ha: μ ≥ 70,000
B. H0: μ ≤70,000 Ha: μ >70,000
C. H0: μ > 70,000 Ha: μ ≤ 70,000
D. H0: μ ≥ 70,000 Ha: μ < 70,000
6. Find the z-scores for which 98% of the distribution's area lies between -z and z.
A. (-0.99, 0.99) B. (-1.645, 1.645) C. (-1.96, 1.96) D. (-2.33, 2.33)
7. Find the z-score for which 70% of the distribution's area lies to its right.
A. -0.47 B. -0.98 C. -0.81 D. -0.53
8. IQ test scores are normally distributed with a mean of 100 and a standard deviation of 15. Find the x -score that corresponds to a z-score of 2.33.
A. 134.95 B. 125.95 C. 139.55 D. 142.35
9. Use the Central Limit Theorem to find the mean and standard error of the mean of the indicated sampling distribution.
The amounts of time employees of a telecommunications company have worked for the company are normally distributed with a mean of 5.1 years and a standard deviation of 2.0 years. Random samples of size 18 are drawn from the population and the mean of each sample is determined.
A. 5.1 years, 0.47 years B. 5.1 years, 0.11 years
C. 1.2 years, 0.47 years D. 1.2 years, 2.0 years
10. Whenever using the t distribution for interval estimation (when the sample size is very small), we must assume that
A. the sample has a mean of at least 30
B. the sampling distribution is not normal
C. the population is approximately normal
D. the finite population correction factor is necessary
11. A sample of 200 elements from a population with a known standard deviation is selected. For an interval estimation of μ, the proper distribution to use is the
A. normal distribution
B. t distribution with 200 degrees of freedom
C. t distribution with 201 degrees of freedom
D. t distribution with 202 degrees of freedom
12. A nurse at a local hospital is interested in estimating the birth weight of infants. How large a sample must she select if she desires to be 99% confident that the true mean is within 2 ounces of the sample mean? The standard deviation of the birth weights is known to be 7 ounces.
A. 82 B. 81 C. 10 D. 9
13. A survey of 100 fatal accidents showed that 12 were alcohol related. Find a point estimate for p, the population proportion of accidents that were alcohol related.
A. 0.12 B. 0.88 C. 0.136 D. 0.107
14. Find the critical value, for a t test, two tail at 1% with a sample size of 25:
A. 1.282 B. 1.96
C.1.645 D. 2.797
15. Given that Z is a standard normal random variable, what is the value of Z if the area to the right of Z is 0.9834?
A. 0.4834
B. -2.13
C. +2.13
D. 0
16. In a random sample of 28 families, the average weekly food expense was $95.60 with a standard deviation of $22.50. Determine whether a normal distribution or a t-distribution should be used or whether neither of these can be used to construct a confidence interval. Assume the distribution of weekly food expenses is normally shaped.
A. Use normal distribution.
B. Use the t-distribution.
C. Cannot use normal distribution or t-distribution.
D. Use the Chi square distribution.
17. The owner of a professional basketball team claims that the mean attendance at games is over 30,000 and therefore the team needs a new arena. Determine whether the hypothesis test for this claim is left-tailed, right-tailed or two-tailed.
A. left-tailed B. two-tailed C. right-tailed D. None of the above.
18. State whether the variable is discrete or continuous. The speed of a car on a Monash freeway during rush hour traffic
A. continuous B. discrete
19. As part of a marketing experiment, a department store regularly mailed discount coupons to 25 of its credit card holders. Their total credit card purchases over the next three months were compared to the credit card purchases over the next three months for 25 credit card holders who were not sent discount coupons. Determine whether the samples are dependent or independent.
A. independent B. dependent
20. Decide if the events A and B are mutually exclusive or not mutually exclusive. A die is rolled.
A: The result is an odd number. B: The result is an even number.
A. not mutually exclusive B. mutually exclusive
Section B - Short Answer Questions
Question 1:
Daily production of gadgets is normally distributed with mean 1000 (µ) and standard deviation 100 (o').
a) What is the probability that today's production will be more than 950?
b) If there are 22 working days in June, how many could be expected to have production being more than 950? (Give your answer to the nearest whole number.)
c) What is the probability that today's production will be between 950 and 1050?
d) The company has a policy that if daily production exceeds a certain level, X, all the workers will get a bonus. Assuming that the company does not want to give the workers a bonus more often that 5% of the time, what value should X have?
e) Find the interquartile range for daily production.
(Hint: It would be helpful if you draw the Z curve and shade the required region to see the required probability).
Question 2(A)
A survey of 20 randomly selected residents in the city of Hot Town found their mean annual income to be $39,580 with standard deviation $7,490.
a) Find a 95% confidence interval on the mean income for all residents in Hot Town, stating clearly the formula you would use.
b) If it is now given that the population standard deviation is known to be $8,000, compute the 99% confidence interval using the same sample mean from part (a) above.
Question 2(B)
The supervisor of a Muesli Bar producing factory noted that the weight of each 30g bar is a normally distributed random variable with a mean of 30.25g and a standard deviation of 0.2g.
a) Find the probability that the mean weight of 5 Muesli bars is less than 30g?
b) Find the probability that the mean weight of 7 Muesli bars is less than 30g?
c) What can you conclude about the probability when the sample size increases? Use your answers to part (a) and (b).
Question 3
A study of the operation of a multi-storey car park in Chadstone plaza shows a historical mean parking time of 220 minutes per car. The car park area has been remodeled and the parking charges have increased. The manager believes that these changes have had an adverse effect on the mean parking time of the customers.
a) Specify the null and alternative hypotheses to test the manager's belief.
b) Is this a one tail or two tailed test?
c) If a sample of 40 cars yields a mean of 208 minutes and a standard deviation of 80 minutes, what conclusion can be drawn at 5% level of significance about the mean parking time by the customers? Show all relevant details and workings to support your conclusion.
d) Explain a type I error in the context of this problem.
Question 4
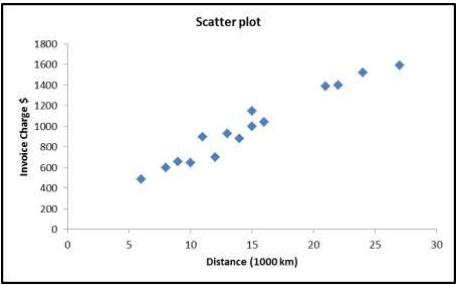
In a study of shipping costs incurred by a firm, a company controller has randomly selected 15 air freight invoices from current shippers in order to estimate the relationship between shipping costs and distance travelled for a given volume of goods. The results of this sample follow.
A summary output of the regression analysis of these data using Excel is given below.
|
Invoice No
|
Distance (in 1000 km)
|
Invoice Charge ($)
|
|
1
|
6
|
490
|
|
2
|
13
|
930
|
|
3
|
27
|
1590
|
|
4
|
15
|
1150
|
|
5
|
9
|
660
|
|
6
|
11
|
900
|
|
7
|
21
|
1390
|
|
8
|
14
|
880
|
|
9
|
12
|
700
|
|
10
|
10
|
650
|
|
11
|
15
|
1000
|
|
12
|
22
|
1400
|
|
13
|
16
|
1040
|
|
14
|
24
|
1520
|
|
15
|
8
|
600
|
|
SUMMARY OUTPUT
|
|
|
|
|
|
|
|
|
|
|
|
|
|
|
|
Regression Statistics
|
|
|
|
|
|
|
Multiple R
|
0.9777
|
|
|
|
|
|
|
R Square
|
0.9559
|
|
|
|
|
|
|
Adjusted R Square
|
0.9525
|
|
|
|
|
|
|
Standard Error
|
76.6408
|
|
|
|
|
|
|
Observations
|
15
|
|
|
|
|
|
|
|
|
|
|
|
|
|
|
ANOVA
|
|
|
|
|
|
|
|
|
df
|
SS
|
MS
|
F
|
Significance F
|
|
|
Regression
|
1
|
1655173.8549
|
1655173.8549
|
281.7890
|
0.0000
|
|
|
Residual
|
13
|
76359.4784
|
5873.8060
|
|
|
|
|
Total
|
14
|
1731533.3333
|
|
|
|
|
|
|
|
|
|
|
|
|
|
|
Coefficients
|
Standard Error
|
t Stat
|
P-value
|
Lower 95%
|
Upper 95%
|
|
Intercept
|
163.887
|
53.227
|
3.079
|
0.009
|
48.898
|
278.876
|
|
Distance (in 1000 k
|
m 55.792
|
3.324
|
16.787
|
0.000
|
48.612
|
62.973
|
Answer the following questions based on the output above.
a) Describe the type of relationship that exists between the Invoice Charges and the Distance travelled.
b) Report the estimated linear regression equation that related Invoice charges to Distance travelled.
c) Interpret the slope coefficient of the regression line.
d) Interpret the intercept of the regression line.
e) Report the value of the coefficient of determination. What information is contained in this value?
f) On the basis of the given regression output, can we say that the linear relationship between Invoice Charges and the Distance travelled is statistically significant at 5% level of significance? Show all relevant details and use the p value approach to support your answer.
g) Predict the Invoice charge if the distance travelled is 2000 Km.
Question 5
A survey of fruit preference of northern and southern Australians was carried out. Researchers were interested to know whether Australians living in northern areas were more interested in tropical fruit because it was plentiful, as opposed to citrus and other fruit. A survey of 500 persons was carried out and the results are given below. Perform a χ2 test to see whether fruit preference and location in Australia are independent. Use a significance level of α= 0.05.
|
OBSERVED FREQUENCIES
|
Fruit Preference
|
|
|
|
Location
|
tropical
|
citrus
|
other
|
Row total
|
|
|
|
|
|
|
|
|
|
Northern Aust
|
130
|
70
|
50
|
250
|
|
|
Southern Aust
|
125
|
45
|
80
|
250
|
|
|
Column total
|
255
|
115
|
130
|
500
|
Grand total
|
a. State the hypotheses that you are testing
b. Determine the critical value of χ2 and your decision rule
c. Calculate the χ2 test statistic for this data. (Show all workings)
d. State your decision and conclusion.
Attachment:- FORMULA SHEET.pdf