Reference no: EM131398865
Did Anyone Ask Whom You've Been Dating?
"According to a new USA Today/Gallup Poll of teenagers across the country, 57% of teens who go out on dates say they've been out with someone of another race or ethnic group" (Peterson, 1997). That's over half of the dating teenagers, so of course it was natural for the headline in the Sacramento Bee to read, "Interracial dates common among today's teenagers." The article contained other information as well, such as "In most cases, parents aren't a major obstacle. Sixty-four percent of teens say their parents don't mind that they date interracially, or wouldn't mind if they did." There are millions of teenagers in the United States whose experiences are being reflected in this story.
How could the polltakers manage to ask so many teenagers these questions? The answer is that they didn't. The article states that "the results of the new poll of 602 teens, conducted Oct. 13-20, reflect the ubiquity of interracial dating today." They asked only 602 teens? Could such a small sample possibly tell us anything about the millions of teenagers in the United States? The answer is "yes" if those teens constituted a random sample from the population of interest.
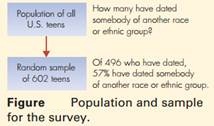
The featured statistic of the article is that "57 percent of teens who go out on dates say they've been out with someone of another race or ethnic group." Only 496 of the 602 teens in the poll said that they date, so the 57% value is actually a percentage based on 496 responses. In other words, the pollsters were using information from only 496 teenagers to estimate something about all teenagers who date. Figure 1.2 illustrates this situation. How accurate could this sample survey possibly be? The answer may surprise you. The results of this poll are accurate to within a margin of error of about 4.5%.
As surprising as it may seem, the true percentage of all dating teens in the United States who date interracially is reasonably likely to be within 4.5% of the reported percentage that's based only on the 496 teens asked! We'll be conservative and round the 4.5% margin of error up to 5%. At the time the poll was taken, the percentage of all dating teenagers in the United States that would say they had dated someone of another race or ethnic group was likely to be in the range 57% 5%, or between 52% and 62%. (The symbol is read "plus and minus" and means that the value on the right should be added to and subtracted from the value on the left to create an interval.)
Polls and sample surveys are frequently used to assess public opinion and to estimate population characteristics such as the percent of teens who have dated interracially or the proportion of voters who plan to vote for a certain candidate. Many sophisticated methods have been developed that allow pollsters to gain the information they need from a very small number of individuals. The trick is to know how to select those individuals. In Chapter 5, we examine a number of other strategies that are used to ensure that sample surveys provide reliable information about populations.
Moral of the Story: A representative sample of only a few thousand, or perhaps even a few hundred, can give reasonably accurate information about a population of many millions.
Definitions: A population is a collection of all individuals about which information is desired. The "individuals" are usually people but could also be schools, cities, pet dogs, agricultural fields, and so on. A random sample is a subset of the population selected so that every individual has a specified probability of being part of the sample. In a poll or sample survey, the investigators gather opinions or other information from each individual included in the sample. The margin of error for a properly conducted survey is a number that is added to and subtracted from the sample information to produce an interval that is 95% certain to contain the true value for the population. In the most common types of sample surveys, the margin of error is approximately equal to 1 divided by the square root of the number of individuals in the sample.
Hence, a sample of 496 teenagers who have dated produces a margin of error of about 1/ 5 .045, or about 4.5%. In some polls the margin of error is called the margin of sampling error to distinguish it from other sources of errors and biases that can distort the results. The next Case Study illustrates a common source of bias that can occur in surveys.
|
Define the elements that marketing applies
: Define the elements that marketing applies to determine the best fit price strategy. Define the elements that marketing applies to set the best fit price. What are some of the key considerations if the product is sold online vs traditional, as well a..
|
|
What is the rationale of the court
: What is (are) the legal issue(s) involved in this case? What is the rationale of the Court? What is the legal reasoning or analysis
|
|
Cultural practices that enable gender inequalities
: What are some current judicial or cultural practices that enable gender inequalities? Moving forward with the knowledge you have gained from this course, as well as any work experience, what issues do you think will become increasingly important to H..
|
|
How does a medical chart help diagnosis and treatment
: How does a medical chart help diagnosis and treatment - What if Nick's friends could not provide complete information? How would this affect his care?
|
|
How could the polltakers manage to ask so many teenagers
: There are millions of teenagers in the United States whose experiences are being reflected in this story. How could the polltakers manage to ask so many teenagers these questions?
|
|
Explain the potential lawsuits
: Using the textbook, the laws of your state, and other scholarly sources, explain the potential lawsuits and the probable outcomes for the lawsuits filed by the injured driver against Brittany, Dr. Carver, and Walgreens
|
|
Read wsj - non-profit hospitals
: Read WSJ - Non-Profit Hospitals, Once for the Poor, Now Strike It Rich then write an analysis based on what you currently know about the health care industry.
|
|
The implications on businesses and business practices
: The management of people and processes has evolved over the years from the “personnel” function to human resources. Discuss this evolution of the function and the implications on businesses and business practices.
|
|
Explain the functions of the three branches of government
: Explain the functions of the three branches of government and why it is important that we have separate branches. Similarly, why are there so many levels of appeals in our court system
|