Reference no: EM132238211
Assignment No. -1
1. How does CPM network facilitate the work of construction management of a project?
2. Define the following terms with reference to CPM/PERT network, Activity, Event, Dummy, Critical path, Physical constraint, Dangling error, Float, Slack, Cost-slope, Optimum duration, Scheduled completion time.
3. Differentiate clearly between the followings i) CPM, PERT and PDM ii) Float and Slack iii) Total Float and Independent Float iv) Direct Cost and Indirect Cost vi) Most likely time and expected mean time vii) Beta distribution curve and Normal Distribution Curve
4. How are logical relationships among activities established? Show by an example that network of a project varies from person to person.
5. List down the various steps to draw a network of a project. Draw a network of a single storeyed building. (Assume all data reasonably)
6. Sketch and explain the various errors in drawing a network diagram.
7. Explain 'Head event', 'Tail event', ëdual role event', 'Successor event' and 'Predecessor event '.
8. Explain Fulkerson's rule for node numbering.
9. Enumerate the physical significance of positive slack, zero, slack and negative slack.
10. Explain three time estimates with reference to PERT.
11. For what do the followings stand:
CPM, PERT, EOT, LOT, EST, EFT, LST, LFT, TF, IF, FF, INT.F.
13. Define Independent float. Show that it can be determined by subtracting the tail event from Free float.
14. Explain how beta distribution curve is suitable to PERT analysis?
Assignment No. -2
1. What is the role of normal distribution curve for finding out the probability of completion of a project?
2. State the Central Limit Theorem with reference to PERT.
3. Define the various floats and show how they are useful in a CPM network.
4. What do you understand by resource leveling? Explain various methods of resource leveling.
5. What do you understand by NETWORK UPDATING? Why it is done?
6. A project consists of 8 activities, draw the network and number the events.
• Activities A, B and E can start concurrently.
• Activities C and D are concurrent and depend on the completion of both A and B.
• Activities F and G are concurrent and depend on the completion of both A and B.
• Activity H depends on completion of D, E and F.
• The project is complete when G and H are done.
7. Draw the network representing the following activity relationship using minimum number of dummies.
i. A, Band C are initial activities.
ii. Q, M and R are finishing activities;
iii. H precedes N but follows D.
iv. E follows D but proceeds N.
v. F and L follow K and B.
vi. F precedes M.
vii. Q follows P, L and N.
viii. L precedes R but follows C.
ix. D follows G.
x. K and D follow A.
xi. F precedes P but follows G.
8. Draw the network for the following situations:
i. A and B can be carried out at the same time.
ii. C follows D.
iii. F depends on E and D.
iv. Neither I nor K can be started before B is completed but they can be concurrently performed.
v. C and E follow A.
vi. E must be carried out before G.
vii. J depends on the completion of I and K.
viii. C and E can be executed at the same time.
ix. P can be started when J, F and G are completed.
x. H is the last activity.
9. For the following CPM network:
• Calculate EST, EFT, LST, LST and all floats of each activity in a tabular form.
• Find critical path and project duration
10. Activities duration (in days) and relationship amongst the various activities of a project are given below:
| Activity |
Duration
|
can start after |
|
A
|
10
|
--
|
|
B
|
8
|
A
|
|
C
|
14 |
--
|
|
D
|
6
|
--
|
|
E
|
12
|
A
|
|
F
|
8
|
B, G
|
|
G
|
12
|
D
|
|
H
|
7
|
C
|
• Develop the network diagram of the project and find its duration and critical path.
• Calculate all floats of non-critical activities.
11. For the following CPM network, all normal direct cost is Rs 15,000 and indirect cost is Rs 250/day, find the most economical project duration of the project.
|
Activity
|
I -node
|
J-node
(days)
|
Normal dur.
(days)
|
Crash dur.
(Rs/day)
|
Cost-slope
|
|
A
|
1
|
3
|
7
|
3
|
50
|
|
B
|
1
|
2
|
9
|
7
|
30
|
|
C
|
3
|
5
|
4
|
1
|
75
|
|
D
|
2
|
5
|
5
|
3
|
125
|
|
E
|
2
|
4
|
3
|
1
|
10
|
|
F
|
5
|
6
|
6
|
4
|
260
|
|
G
|
4
|
6
|
2
|
1
|
500
|
12. With the following data of a CPM project, find the normal duration, optimum duration and minimum duration of the project. Indirect cost is Rs 9O/day.
|
Activity
|
I-node
|
J-node
|
NORMAL
|
CRASH
|
|
|
Dur.(days)
|
Cost(Rs)
|
Dur. (days)
|
Cost (Rs)
|
|
A
|
I
|
2
|
5
|
60
|
4
|
90
|
|
B
|
I
|
3
|
7
|
150
|
5
|
250
|
|
C
|
2
|
3
|
3
|
30
|
2
|
60
|
|
D
|
3
|
5
|
6
|
150
|
4
|
250
|
|
E
|
2
|
4
|
3
|
100
|
3
|
100
|
|
F
|
I
|
5
|
9
|
115
|
7
|
175
|
|
G
|
4
|
5
|
4
|
100
|
2
|
240
|
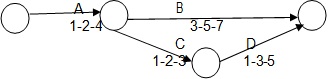
13. Compute expected mean time, Variance and standard deviation of the given PERT network. Three time estimates for each activity have been marked on the arrow diagram and show the critical path.
14. The following information applies to a particular project:
• Event 0 is the initial event
• Event 1 is preceded by event 0
• Event 3 is preceded by event 1
• Event 4 is preceded by event 1
• Event 2 is preceded by event 1
• Event 3 is preceded by event 2 and 1
• Event 4 is preceded by event 3 and I
• Event 5 is preceded by event 4.
For the various activities in the project, the expected times are
|
Activity
|
(0-1)
|
(1-3)
|
(1-2)
|
(2-3)
|
(1-4) (3 -4) (4-5)
|
|
Duration (days)
|
3
|
16
|
6
|
8
|
10 5 3
|
Draw the arrow diagram for this project. If the scheduled completion time is equal to the earliest expected time for the end event, calculate the slack event and identify the critical path.
15. The three time estimates of each activity of a project are given below:
|
Activity
|
ta (days)
|
tm (days)
|
tb (days)
|
|
1- 2
|
2
|
5
|
14
|
|
1-3
|
3
|
12
|
21
|
|
2-4
|
5
|
14
|
17
|
|
3-4
|
2
|
5
|
8
|
|
4-5
|
1
|
4
|
7
|
|
3 -5
|
6
|
15
|
30
|
• Draw the network diagram.
• Find the expected duration and variance of each activity.
• Calculate early and late occurrence times for each event.
• Determine the expected project duration.
• Calculate the total float for each activity.
• Find the variance and standard deviation of the entire project.